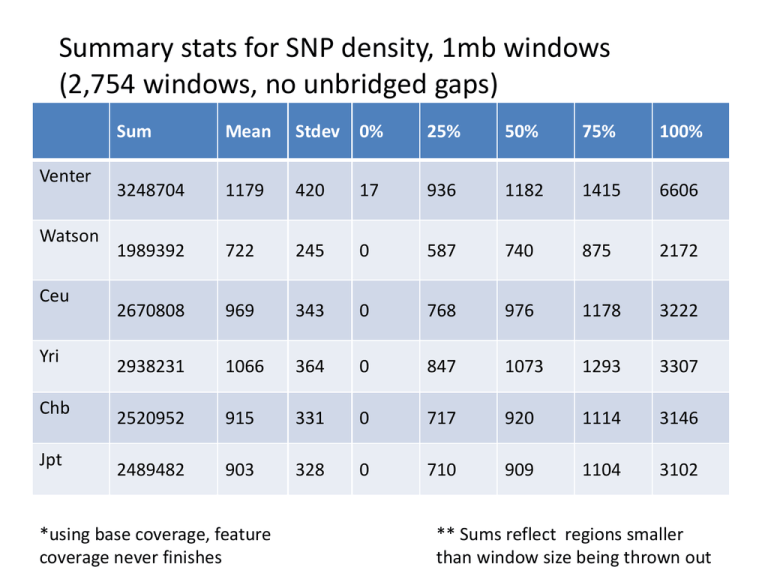
Summary stats for SNP density, 1mb windows
advertisement

Summary stats for SNP density, 1mb windows (2,754 windows, no unbridged gaps) Venter Watson Ceu Yri Chb Jpt Sum Mean Stdev 0% 25% 50% 75% 100% 3248704 1179 420 17 936 1182 1415 6606 1989392 722 245 0 587 740 875 2172 2670808 969 343 0 768 976 1178 3222 2938231 1066 364 0 847 1073 1293 3307 2520952 915 331 0 717 920 1114 3146 2489482 903 328 0 710 909 1104 3102 *using base coverage, feature coverage never finishes ** Sums reflect regions smaller than window size being thrown out SNP density 100kb windows (28,442) Venter Watson Ceu Yri Chb Jpt dbSNP 126 Sum Mean Stdev 0% 25% 50% 75% 100% 3347391 117 69 0 71 113 156 1851 2052667 72 41 0 45 71 97 1107 2725973 95 47 0 63 93 125 557 2998514 105 50 0 71 102 136 557 2573242 90 46 0 58 87 119 622 2541151 89 46 0 57 86 117 574 12266167 430 259 20 303 386 496 12479 dbSNP 126 has 12million SNPs, including randoms , etc. The region with the most SNPs is chr16 44943302-45043302 Regions with no SNPs (100kb) • Watson and Venter have 121 regions in common (292 & 162) • All HapMap has 444 in common (469-487) • They all have 111 in common – dbSNP has entries in these regions – Ensembl has a few Watson SNPs and many Venter SNPs (only 2 in chrY remained 0) here Genome Graphs import uses a 10kb window for computing depth and coverage. For these graphs depth was chosen and connections were drawn between items up to 1mb away. Ceu was done with both 1mb connections and 10kb connections and there wasn’t a noticeable difference. Graph A Watson Venter Ceu Watson Graph B ceu yri chb jpt ceu yri chb jpt yri Venter R .547 .511 .553 .554 .463 .424 .470 .471 .942 .539 R-Squared .299 .261 .306 .307 .214 .180 .221 .221 .888 .290 Allele comparisons Watson Venter Exact match 1 or more Exact match 1 or more Ceu 38.9% 49.2% 21.2% 37.5% Chb 37.0% 48.3% 21.3% 36.6% Jpt 36.5% 48.0% 21.2% 36.4% Yri 38.0% 47.3% 18.3% 35.9% Percent = (matches/total SNPs)*100 Total SNPs is Watson or Venter 1 or more includes the exact matches Coding SNPs (RefSeq Genes) • Watson – 857 substitutions • 779 in dbSNP 128 • 706 heterozygous • Venter – 13 frameshifts • 1 in dbSNP 128 • 13 heterozygous – 1109 substitutions • 1003 in dbSNP 128 • 648 heterozygous Comparing Venter’s deletion to alignments • 96,181 deletions • Extracted maf for +- 2bps of deletions • Found no deletions in other species at the same locations • Found from 0 to 27 species with alignments – Mean 2 per deletion, median 1, max 27 – chr9 36092117 36092118 A/- The max region The gene OMIM Watson homozygous? SNPs • Only 1 allele found, not guaranteed homozygous • Found 382024 SNPs • matching species: min 0, max 27 (2 SNPs), ave 3, median 2 – 18,935 with 10 or more species • aligned but not matching: min 0, max 27 (2 SNPs), ave 3, median 2 – 25,663 with 10 or more species Venter Homozygous? SNPs • • • • Only 1 allele found, not guaranteed homozygous 1,450,836 SNPs matching species: min 0, max 27 ,ave 3, median 2 aligned but not matching: min 0, max 27, ave 3, median 2


