Math 146 – Introductory Statistics – Fall 2014
advertisement
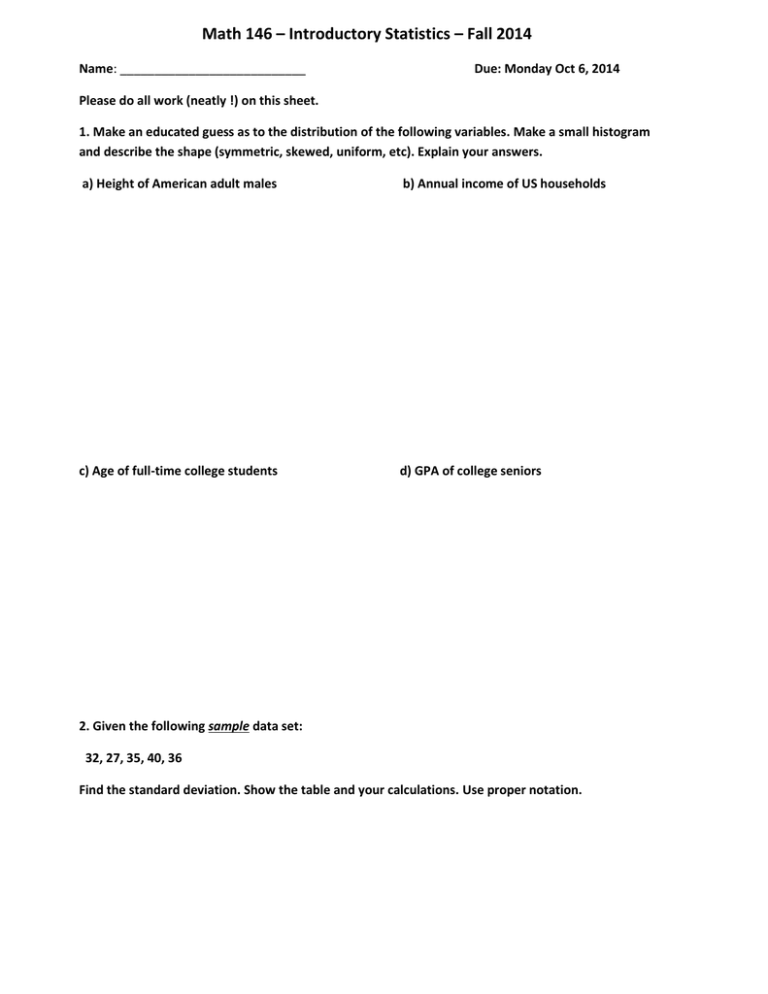
Math 146 – Introductory Statistics – Fall 2014 Name: ___________________________ Due: Monday Oct 6, 2014 Please do all work (neatly !) on this sheet. 1. Make an educated guess as to the distribution of the following variables. Make a small histogram and describe the shape (symmetric, skewed, uniform, etc). Explain your answers. a) Height of American adult males b) Annual income of US households c) Age of full-time college students d) GPA of college seniors 2. Given the following sample data set: 32, 27, 35, 40, 36 Find the standard deviation. Show the table and your calculations. Use proper notation. 3. x 2 --- means to square all the x-values and then add all the squared values so if the x values are: 2 , 3, 4 x 2 2 = 4 + 9 + 16 = 29 --- means add up all the x values (you get a single number) and then square that number so if the x values are: 2 , 3, 4 Find x x 2 and x 2 x 2 = (2 + 3 + 4 )2 = 92 = 81 for the following data points: -3, 5, -1, 6, 4 4. Find the standard deviation of the sample from #2 above using the following formula: s x 2 ( x ) 2 / n n 1 (formula is on p. 312 of text) Show your calculations. Compare your answer to the value you calculated in #1. Which formula was easier? 5. Given the following sets of data: SampleA : 247.2 234.1, 254.7, 238.9, 251.0 SampleB: 20.1, -216.4, 146.0, -25.0, 83.1, -126.8 SampleC: 310.1, 309.8, 311.4, 310.5, 311.2 Without doing any calculations, answer the following: a) Which set has the largest mean? b) the largest s? c) the largest s2 ? d) Give another data set which has a smaller mean than SampleC and a larger s than SampleC.
