Minitab Project Report 3C Histogram of C3
advertisement
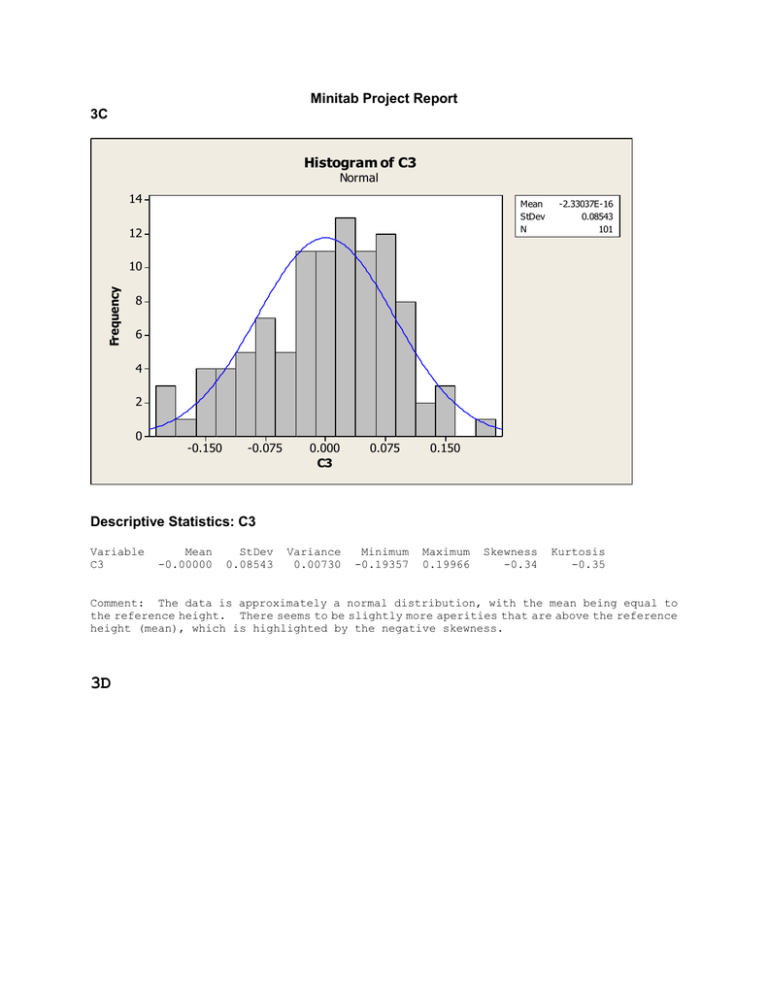
Minitab Project Report 3C Histogram of C3 Normal 14 Mean StDev N 12 -2.33037E-16 0.08543 101 Frequency 10 8 6 4 2 0 -0.150 -0.075 0.000 C3 0.075 0.150 Minimum -0.19357 Maximum 0.19966 Descriptive Statistics: C3 Variable C3 Mean -0.00000 StDev 0.08543 Variance 0.00730 Skewness -0.34 Kurtosis -0.35 Comment: The data is approximately a normal distribution, with the mean being equal to the reference height. There seems to be slightly more aperities that are above the reference height (mean), which is highlighted by the negative skewness. 3D Autocorrelation Function for C3 (with 5% significance limits for the autocorrelations) 0.2 Autocorrelation 0.1 0.0 -0.1 -0.2 1 2 3 4 5 6 7 8 9 10 Lag Autocorrelation Function: C3 Lag 1 2 3 4 5 6 7 8 9 10 ACF 0.066991 -0.127087 -0.056701 0.053331 -0.061358 0.090724 -0.103898 -0.038582 0.084875 0.028492 T 0.67 -1.27 -0.56 0.52 -0.60 0.89 -1.01 -0.37 0.81 0.27 LBQ 0.47 2.16 2.51 2.81 3.22 4.12 5.31 5.48 6.30 6.39 Comment: Above is the graph of value of the autocorrelation for different lags (i.e. offsets). The positive correlations at 1, 4, 6, 9 shows that these distance from the the reference point, there are similarities in the the heights. This allows one to see the general height as a function of distance along the surface. The negative correlation values show that there is not a good correlation between the reference surface height and the surface height X (i.e. 2,3,5,7,8) microns away.

