Engine Oil Viscosity vs. Temperature Graph Explained
advertisement
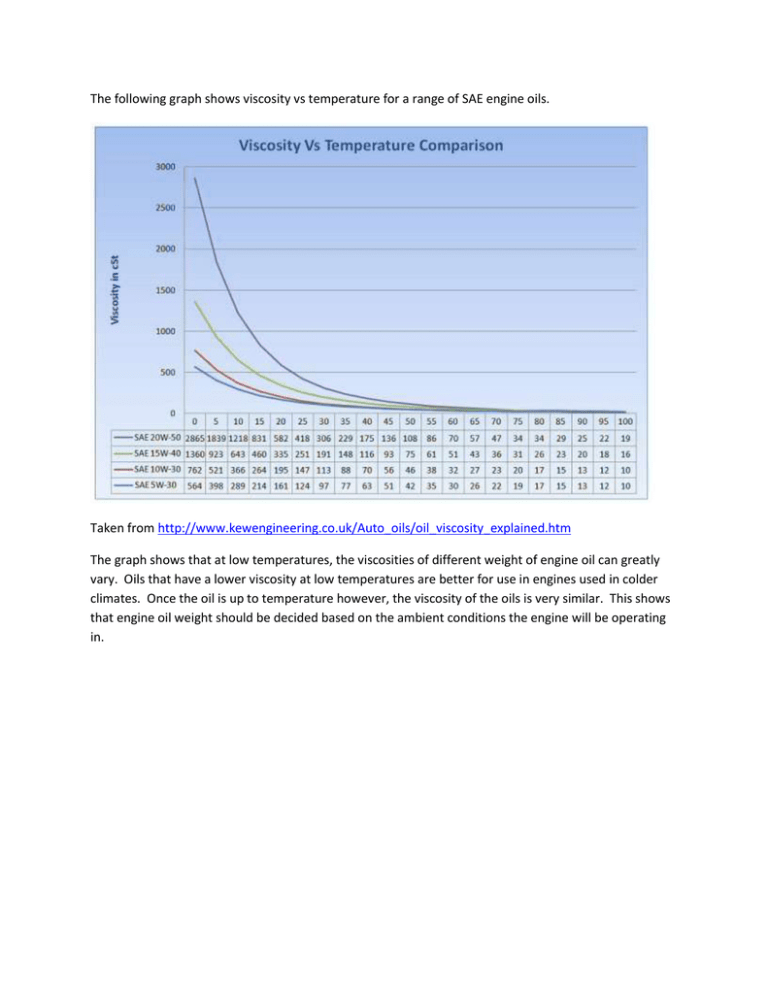
The following graph shows viscosity vs temperature for a range of SAE engine oils. Taken from http://www.kewengineering.co.uk/Auto_oils/oil_viscosity_explained.htm The graph shows that at low temperatures, the viscosities of different weight of engine oil can greatly vary. Oils that have a lower viscosity at low temperatures are better for use in engines used in colder climates. Once the oil is up to temperature however, the viscosity of the oils is very similar. This shows that engine oil weight should be decided based on the ambient conditions the engine will be operating in.


