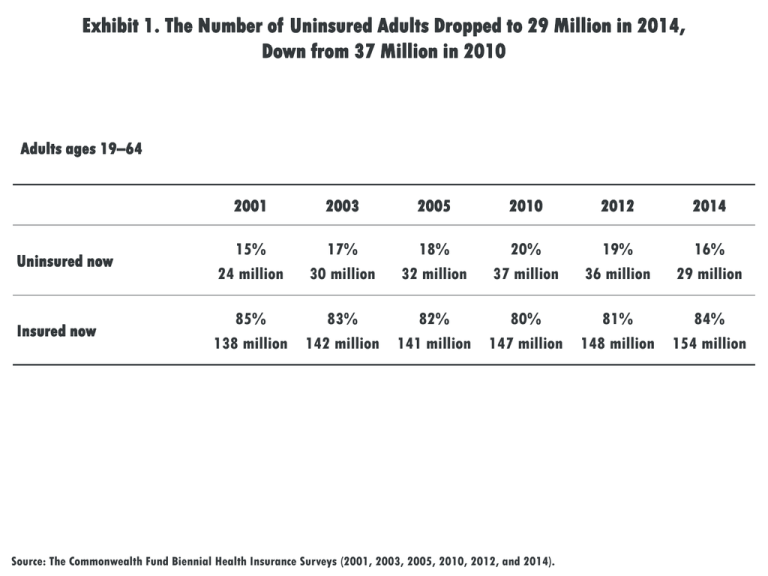
Exhibit 1. The Number of Uninsured Adults Dropped to 29... Down from 37 Million in 2010
advertisement

Exhibit 1. The Number of Uninsured Adults Dropped to 29 Million in 2014, Down from 37 Million in 2010 Adults ages 19–64 2001 2003 2005 2010 2012 2014 Uninsured now 15% 24 million 17% 30 million 18% 32 million 20% 37 million 19% 36 million 16% 29 million Insured now 85% 138 million 83% 142 million 82% 141 million 80% 147 million 81% 148 million 84% 154 million Source: The Commonwealth Fund Biennial Health Insurance Surveys (2001, 2003, 2005, 2010, 2012, and 2014). Exhibit 2. Young Adults Have Made the Greatest Gains in Coverage of Any Age Group Percent of adults ages 19–64 who are uninsured 50 2001 40 2003 30 20 15 17 18 22 20 19 24 2005 2010 2012 2014 26 27 23 19 20 19 16 22 15 17 12 9 10 11 10 13 13 0 Total Ages 19–34 Ages 35–49 Source: The Commonwealth Fund Biennial Health Insurance Surveys (2001, 2003, 2005, 2010, 2012, and 2014). Ages 50–64 11 Exhibit 3. People with Incomes Under $48,000 for a Family of Four Experienced the Largest Declines in Uninsured Rates Percent of adults ages 19–64 2001 50 2003 2005 39 40 34 30 30 20 2010 2012 2014 36 32 24 15 17 18 20 19 16 10 6 7 9 7 9 0 Total <200% FPL <$47,100 Note: FPL refers to federal poverty level. Income levels are for a family of four in 2013. Source: The Commonwealth Fund Biennial Health Insurance Surveys (2001, 2003, 2005, 2010, 2012, and 2014). 200% FPL or more $47,100+ 7 Exhibit 4. Uninsured Rates Declined Among Whites, Blacks, and Latinos in 2014 Percent of adults ages 19–64 50 2010 2012 2014 39 40 40 34 30 24 20 20 19 20 16 15 18 14 10 10 0 Total Non-Hispanic White Source: The Commonwealth Fund Biennial Health Insurance Surveys (2010, 2012, and 2014). Black Latino Exhibit 5. The Number of Adults Reporting Not Getting Needed Care Because of Cost Declined in 2014 for the First Time Since 2003 Percent of adults ages 19–64 2003 2005 2010 2012 2014 Had a medical problem, did not visit doctor or clinic 22% 38 million 24% 41 million 26% 49 million 29% 53 million 23% 42 million Did not fill a prescription 23% 39 million 25% 43 million 26% 48 million 27% 50 million 19% 35 million Skipped recommended test, treatment, or follow-up 19% 32 million 20% 34 million 25% 47 million 27% 49 million 19% 35 million Did not get needed specialist care 13% 22 million 17% 30 million 18% 34 million 20% 37 million 13% 23 million 37% 63 million 37% 64 million 41% 75 million 43% 80 million 36% 66 million In the past 12 months: Any of the above access problems Source: The Commonwealth Fund Biennial Health Insurance Surveys (2003, 2005, 2010, 2012, and 2014). Exhibit 6. Uninsured Adults Report Cost-Related Problems Getting Needed Care at Twice the Rate of Insured Adults Percent of adults ages 19–64 who had any of four access problems* in past year because of cost Total Insured all year Uninsured during the year 75 59 57 50 55 45 36 28 33 25 29 25 0 Total <200% FPL <$47,100 200% FPL or more $47,100+ Notes: FPL refers to federal poverty level. Income levels are for a family of four in 2013. * Did not fill a prescription; did not see a specialist when needed; skipped recommended medical test, treatment, or follow-up; had a medical problem but did not visit doctor or clinic. Source: The Commonwealth Fund Biennial Health Insurance Survey (2014). Exhibit 7. The Number of Adults Reporting Medical Bill Problems Declined in 2014 for the First Time Since 2005 Percent of adults ages 19–64 2005 2010 2012 2014 Had problems paying or unable to pay medical bills 23% 39 million 29% 53 million 30% 55 million 23% 43 million Contacted by a collection agency about medical bills* 21% 36 million 23% 42 million 22% 41 million 20% 37 million Contacted by collection agency for unpaid medical bills 13% 22 million 16% 30 million 18% 32 million 15% 27 million Contacted by a collection agency because of billing mistake 7% 11 million 5% 9 million 4% 7 million 4% 8 million 14% 24 million 17% 31 million 16% 29 million 14% 26 million Any of three bill problems (does not include billing mistake) 28% 48 million 34% 62 million 34% 63 million 29% 53 million Medical bills being paid off over time 21% 37 million 24% 44 million 26% 48 million 22% 40 million Any of three bill problems or medical debt 34 % 58 million 40% 73 million 41% 75 million 35% 64 million In the past 12 months: Had to change way of life to pay bills * Subtotals may not sum to total: respondents who answered “don’t know” or refused are included in the distribution but not reported. Source: The Commonwealth Fund Biennial Health Insurance Surveys (2005, 2010, 2012, and 2014). Exhibit 8. Uninsured Adults Reported Having Medical Bill Problems at Higher Rates Than Did Insured Adults Percent of adults ages 19–64 who had medical bill problems or accrued medical debt* 75 Total Insured all year 54 51 50 Uninsured during the year 44 43 35 29 34 30 27 25 0 Total <200% FPL <$47,100 200% FPL or more $47,100+ Notes: FPL refers to federal poverty level. Income levels are for a family of four in 2013. * Had problems paying medical bills, contacted by a collection agency for unpaid bills, had to change way of life in order to pay medical bills, or has outstanding medical debt. Source: The Commonwealth Fund Biennial Health Insurance Survey (2014). Exhibit 9. Uninsured Adults Are Less Likely to Have a Regular Source of Care, 2014 Percent of adults ages 19–64 Total 100 88 75 94 88 71 Insured all year Uninsured during the year 93 77 79 71 51 50 43 49 26 25 0 Regular source of care Blood pressure checked Cholesterol checked Seasonal flu shot Notes: Blood pressure checked in past two years (in past year if has hypertension or high blood pressure); cholesterol checked in past five years (in past year if has hypertension, heart disease, or high cholesterol); seasonal flu shot in past 12 months. Source: The Commonwealth Fund Biennial Health Insurance Survey (2014). Exhibit 10. Uninsured Adults Have Lower Rates of Cancer Screening Tests, 2014 Percent of adults Total 100 75 75 Insured all year Uninsured during the year 80 70 61 56 75 61 49 50 32 25 0 Received Pap test Received colon cancer screening Received mammogram Notes: Pap test in past three years for females ages 21–64; colon cancer screening in past five years for adults ages 50–64; and mammogram in past two years for females ages 40–64. Source: The Commonwealth Fund Biennial Health Insurance Survey (2014). Exhibit 11. Among Adults with Incomes Below $24,000 for a Family of Four, the Uninsured Rate Is Lowest in States That Expanded Medicaid Percent of adults ages 19–64 with incomes <100% FPL who are uninsured 50 40 2012 2014 37 44 35 30 27 30 19 20 10 0 Total Expanded Medicaid Did not expand Medicaid Note: FPL refers to federal poverty level. 26 states and DC had expanded eligibility for their state Medicaid program and begun enrolling individuals by July 2014: AR, AZ, CA, CO, CT, DC, DE, HI, IA, IL, KY, MA, MD, MI, MN, ND, NH, NJ, NM, NV, NY, OH, OR, RI, VT, WA, WV. All other states were counted as not expanding Medicaid. AK and HI were not included in the survey sample. Source: The Commonwealth Fund Biennial Health Insurance Surveys (2012 and 2014). Exhibit 12. Uninsured Rates Have Dropped in Both States with State-Based Marketplaces and Those with Federally Facilitated Marketplaces Percent of adults ages 19–64 50 2012 2014 40 30 20 19 16 17 20 13 23 17 20 14 9 10 0 Total State-based marketplace Federally facilitated marketplace State expanded State did not Medicaid expand Medicaid Federally facilitated marketplace Note: The following 16 states and DC have state-based marketplaces: CA, CO, CT, DC, HI, ID, KY, MA, MD, MN, NM, NV, NY, OR, RI, VT, WA. All other states have federally facilitated marketplaces. 26 states and DC had expanded eligibility for their state Medicaid program and begun enrolling individuals by July 2014: AR, AZ, CA, CO, CT, DC, DE, HI, IA, IL, KY, MA, MD, MI, MN, ND, NH, NJ, NM, NV, NY, OH, OR, RI, VT, WA, WV. All other states were counted as not expanding Medicaid. AK and HI were not included in the survey sample. Source: The Commonwealth Fund Biennial Health Insurance Surveys (2012 and 2014). Exhibit 13. Nearly Half of the Remaining Uninsured Have Incomes That Would Make Them Eligible for Expanded Medicaid Age 19–34 42% Income 35–49 34% <133% FPL 49% State Medicaid Decision 133%–399% FPL 35% 50–64 24% Refused 11% Expanded Medicaid 39% Did not expand Medicaid 61% 400% FPL or more 5% 29 million uninsured adults ages 19 to 64 Notes: FPL refers to federal poverty level. Segments may not sum to 100 percent because of rounding. 26 states and DC had expanded eligibility for their state Medicaid program and begun enrolling individuals by July 2014: AR, AZ, CA, CO, CT, DC, DE, HI, IA, IL, KY, MA, MD, MI, MN, ND, NH, NJ, NM, NV, NY, OH, OR, RI, VT, WA, WV. All other states were counted as not expanding Medicaid. AK and HI were not included in the survey sample. Source: The Commonwealth Fund Biennial Health Insurance Survey (2014).

