Second Grade Graphs and Data
advertisement
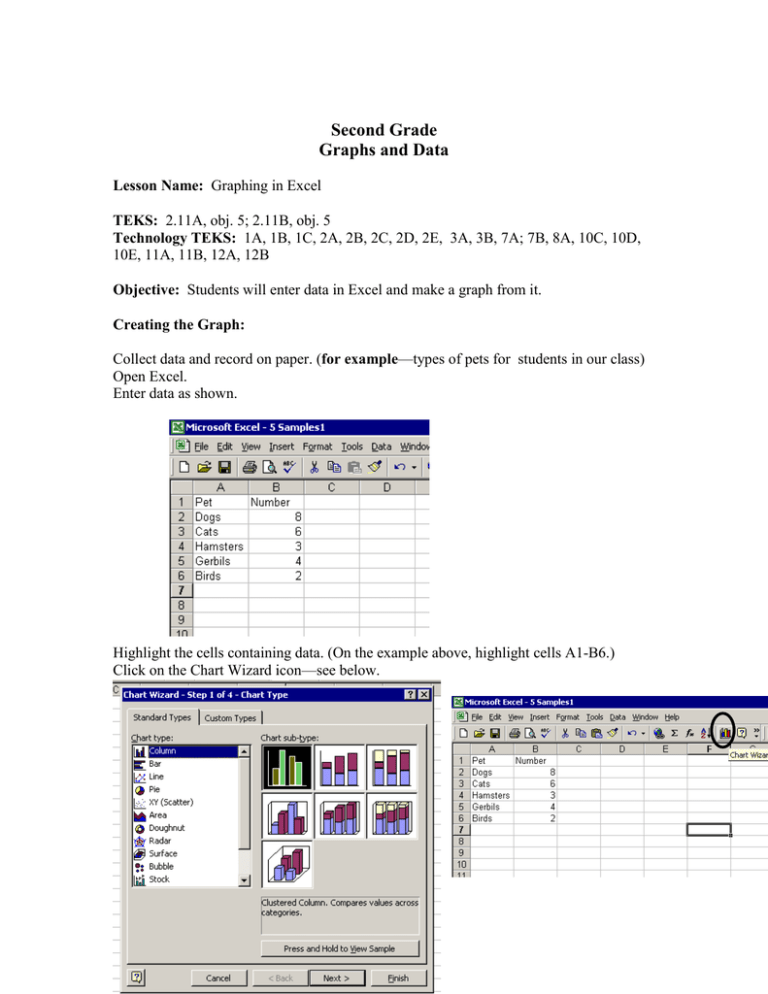
Second Grade Graphs and Data Lesson Name: Graphing in Excel TEKS: 2.11A, obj. 5; 2.11B, obj. 5 Technology TEKS: 1A, 1B, 1C, 2A, 2B, 2C, 2D, 2E, 3A, 3B, 7A; 7B, 8A, 10C, 10D, 10E, 11A, 11B, 12A, 12B Objective: Students will enter data in Excel and make a graph from it. Creating the Graph: Collect data and record on paper. (for example—types of pets for students in our class) Open Excel. Enter data as shown. Highlight the cells containing data. (On the example above, highlight cells A1-B6.) Click on the Chart Wizard icon—see below. Choose the type of graph: Click Next. In this window, click Next. *In this window, type a title for the graph: Click Next and choose method of printing. Click Finish. *Suggestion: Make the title include the child’s name, so when it is printed, the teacher will always know which graph belongs to which student. For instance, “Vanessa’s Graph of Pets” or “John’s Graph.”
