Lab 3012 Biology of Growth and Development Tracey Hoffman
advertisement
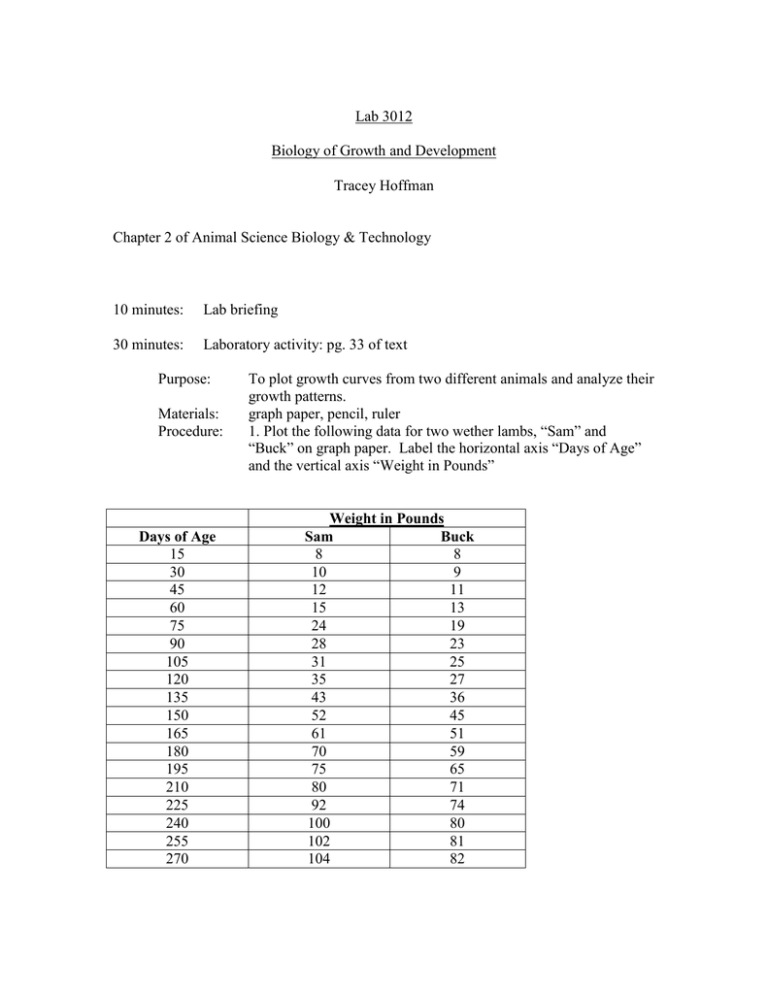
Lab 3012 Biology of Growth and Development Tracey Hoffman Chapter 2 of Animal Science Biology & Technology 10 minutes: Lab briefing 30 minutes: Laboratory activity: pg. 33 of text Purpose: Materials: Procedure: Days of Age 15 30 45 60 75 90 105 120 135 150 165 180 195 210 225 240 255 270 To plot growth curves from two different animals and analyze their growth patterns. graph paper, pencil, ruler 1. Plot the following data for two wether lambs, “Sam” and “Buck” on graph paper. Label the horizontal axis “Days of Age” and the vertical axis “Weight in Pounds” Weight in Pounds Sam Buck 8 8 10 9 12 11 15 13 24 19 28 23 31 25 35 27 43 36 52 45 61 51 70 59 75 65 80 71 92 74 100 80 102 81 104 82 Procedure: 2. Connect the dots for each lamb to form a growth curve. 3. Identify the points where growth accelerates 4. Identify the growth line. Analysis: 1. Which lamb appeared to mature at the heavier weight? 2. Was there a difference in the time it took the lambs to reach maturity? 3. Was there any difference in the growth rate of the lambs? 4. Which lamb would you expect to be fatter upon reaching 80 pounds?
