LOYOLA COLLEGE (AUTONOMOUS), CHENNAI – 600 034
advertisement
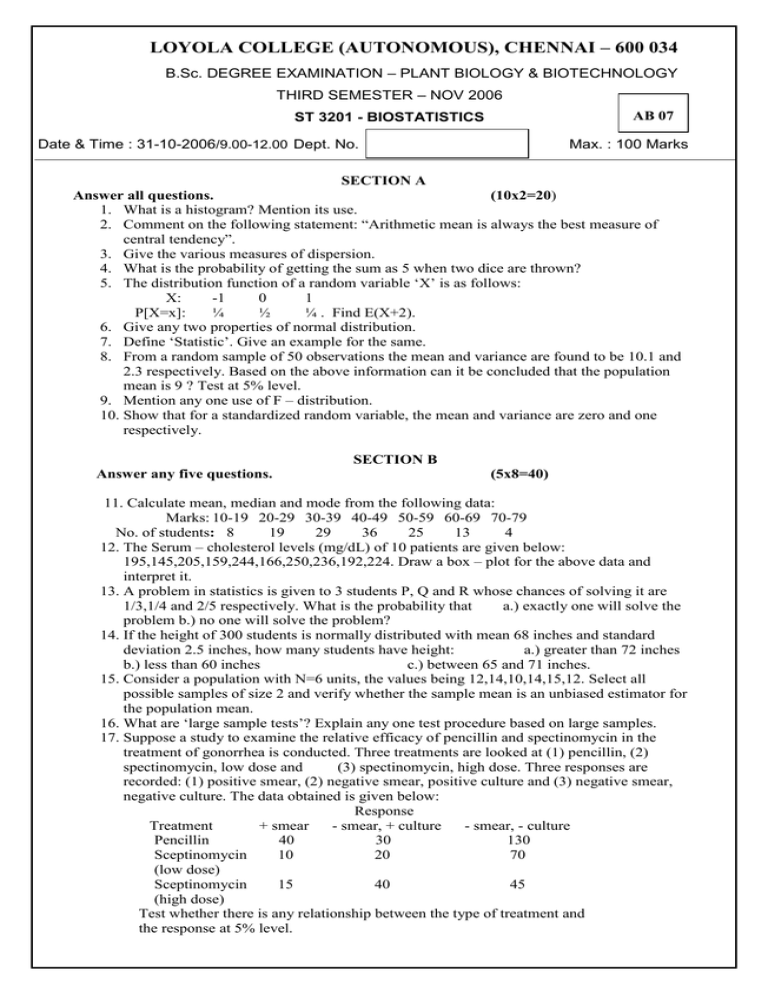
LOYOLA COLLEGE (AUTONOMOUS), CHENNAI – 600 034 B.Sc. DEGREE EXAMINATION – PLANT BIOLOGY & BIOTECHNOLOGY THIRD SEMESTER – NOV 2006 AB 07 ST 3201 - BIOSTATISTICS Date & Time : 31-10-2006/9.00-12.00 Dept. No. Max. : 100 Marks SECTION A Answer all questions. (10x2=20) 1. What is a histogram? Mention its use. 2. Comment on the following statement: “Arithmetic mean is always the best measure of central tendency”. 3. Give the various measures of dispersion. 4. What is the probability of getting the sum as 5 when two dice are thrown? 5. The distribution function of a random variable ‘X’ is as follows: X: -1 0 1 P[X=x]: ¼ ½ ¼ . Find E(X+2). 6. Give any two properties of normal distribution. 7. Define ‘Statistic’. Give an example for the same. 8. From a random sample of 50 observations the mean and variance are found to be 10.1 and 2.3 respectively. Based on the above information can it be concluded that the population mean is 9 ? Test at 5% level. 9. Mention any one use of F – distribution. 10. Show that for a standardized random variable, the mean and variance are zero and one respectively. SECTION B Answer any five questions. (5x8=40) 11. Calculate mean, median and mode from the following data: Marks: 10-19 20-29 30-39 40-49 50-59 60-69 70-79 No. of students: 8 19 29 36 25 13 4 12. The Serum – cholesterol levels (mg/dL) of 10 patients are given below: 195,145,205,159,244,166,250,236,192,224. Draw a box – plot for the above data and interpret it. 13. A problem in statistics is given to 3 students P, Q and R whose chances of solving it are 1/3,1/4 and 2/5 respectively. What is the probability that a.) exactly one will solve the problem b.) no one will solve the problem? 14. If the height of 300 students is normally distributed with mean 68 inches and standard deviation 2.5 inches, how many students have height: a.) greater than 72 inches b.) less than 60 inches c.) between 65 and 71 inches. 15. Consider a population with N=6 units, the values being 12,14,10,14,15,12. Select all possible samples of size 2 and verify whether the sample mean is an unbiased estimator for the population mean. 16. What are ‘large sample tests’? Explain any one test procedure based on large samples. 17. Suppose a study to examine the relative efficacy of pencillin and spectinomycin in the treatment of gonorrhea is conducted. Three treatments are looked at (1) pencillin, (2) spectinomycin, low dose and (3) spectinomycin, high dose. Three responses are recorded: (1) positive smear, (2) negative smear, positive culture and (3) negative smear, negative culture. The data obtained is given below: Response Treatment + smear - smear, + culture - smear, - culture Pencillin 40 30 130 Sceptinomycin 10 20 70 (low dose) Sceptinomycin 15 40 45 (high dose) Test whether there is any relationship between the type of treatment and the response at 5% level. 18. Explain the procedure for testing a specified value of Population median. SECTION C Answer any two questions. (2x20=40) 19. a.) Find mean deviation about mean and median and their coefficients from the following data: X: 10 17 20 24 14 f: 5 12 18 12 3 b.) Assume that a factory has two machines. Past records show that machine 1 produces 30% of the items of the output and machine 2 produces 70% of the items. Further 5% of the items produced by machine 1 were defective and only 1% produced by machine 2 were defective. If a defective item is drawn at random, what is the probability that it was produced by a.) machine 1 b.) machine 2 ? (12+8) 20. a.) If 20% of the bolts produced by a machine are defective, determine the probability that out of 4 bolts chosen at random i.) one ii.) none will be defective. b.) A typist in a company commits the following number of mistakes per page in typing 432 pages: Mistakes per page: 0 1 2 3 4 No. of pages: 223 142 48 15 4 Fit a Poisson distribution to the above data and test the goodness of fit at 5% level. c.) Define the following terms: i.) random experiment ii.) sample space iii.) event. (4+12+4) 21. a.) In a random sample of 800 people from city A, 220 were found having typhoid while in a random sample of 600 people from city B 145 were having typhoid. Test at 5% level whether the proportion of people suffering from typhoid in the two cities are equal. b.) Below are given the gains in weights(lb.) of lions fed on two diets X and Y respectively: Diet X: 25 32 30 32 24 14 32 Diet Y: 24 34 22 30 42 31 40 30 35 Test, at 5% level, whether the mean gain in weight between the two diets is significant. (8+12) 22 a.) Let M be the median lung capacity in liters for males. Use the Wilcoxon statistic with the following 17 observations to test, at 5% level, the null hypothesis H0: M = 4.7 against a two sided alternative hypothesis: 4.3 5.0 5.7 6.2 4.8 4.7 5.6 5.2 3.7 5.6 6.8 4.9 7.6 5.4 3.8 5.6 b.) Explain the following: i.) Random Variable ii.) Addition theorem of probability iii.) Percentiles iv.) Type 1 Error. (10+10) ______________________________ 32 4.0
