LOYOLA COLLEGE (AUTONOMOUS), CHENNAI – 600 034
advertisement
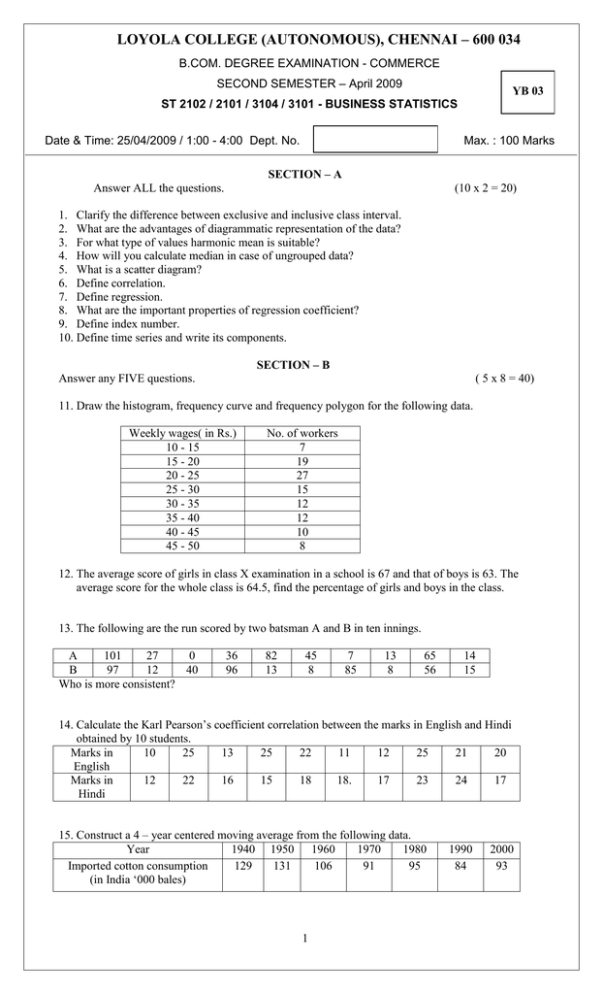
LOYOLA COLLEGE (AUTONOMOUS), CHENNAI – 600 034 B.COM. DEGREE EXAMINATION - COMMERCE SECOND SEMESTER – April 2009 YB 03 ST 2102 / 2101 / 3104 / 3101 - BUSINESS STATISTICS Date & Time: 25/04/2009 / 1:00 - 4:00 Dept. No. Max. : 100 Marks SECTION – A Answer ALL the questions. (10 x 2 = 20) 1. Clarify the difference between exclusive and inclusive class interval. 2. What are the advantages of diagrammatic representation of the data? 3. For what type of values harmonic mean is suitable? 4. How will you calculate median in case of ungrouped data? 5. What is a scatter diagram? 6. Define correlation. 7. Define regression. 8. What are the important properties of regression coefficient? 9. Define index number. 10. Define time series and write its components. SECTION – B Answer any FIVE questions. ( 5 x 8 = 40) 11. Draw the histogram, frequency curve and frequency polygon for the following data. Weekly wages( in Rs.) 10 - 15 15 - 20 20 - 25 25 - 30 30 - 35 35 - 40 40 - 45 45 - 50 No. of workers 7 19 27 15 12 12 10 8 12. The average score of girls in class X examination in a school is 67 and that of boys is 63. The average score for the whole class is 64.5, find the percentage of girls and boys in the class. 13. The following are the run scored by two batsman A and B in ten innings. A 101 27 0 B 97 12 40 Who is more consistent? 36 96 82 13 45 8 7 85 13 8 65 56 14 15 14. Calculate the Karl Pearson’s coefficient correlation between the marks in English and Hindi obtained by 10 students. Marks in 10 25 13 25 22 11 12 25 21 20 English Marks in 12 22 16 15 18 18. 17 23 24 17 Hindi 15. Construct a 4 – year centered moving average from the following data. Year 1940 1950 1960 1970 1980 Imported cotton consumption 129 131 106 91 95 (in India ‘000 bales) 1 1990 84 2000 93 16. Compute Laspeyre’s, Paasche’s, Fisher’s and Kelly’s Price index numbers for 2005 for the following data. Commodity 2000 Price Rs. 15 20 4 A B C 2005 Quantity 15 5 10 Price 22 27 7 Quantity 12 4 5 17. Explain the components of time series. 18. Find the minimum value of z = – x1 + x2 subject to the constraints – x1 + 3 x2 ≤ 10 x1 + x2 ≤ 6 x1 – x2 ≤ 10 x1 , x2 ≥ 0. SECTION –C Answer any TWO questions. ( 2 x 20 =40) 19. Find the median, lower quartile, 7th decile and 85th percentile of the frequency distribution given below. Marks in Below 10 10-20 20-30 30-40 40-50 50-60 60-70 Above70 statistics No. of students 8 12 20 32 30 28 12 4 20 a). Ten competitors in a beauty contest are ranked by three judges in the following orders: 1st Judge 2nd Judge 3rd Judge 1 3 6 6 5 4 5 8 9 10 4 8 3 7 1 2 10 2 4 2 3 9 1 10 7 6 5 8 9 7 Use the correlation coefficient to determine which pair of judges has the nearest approach to common taste in beauty. b). From the following data, obtain two regression equations: Sales 91 Purchases 71 97 75 108 69 121 97 67 70 124 91 51 39 73 61 111 80 57 47 21). Find the seasonal variations by Ratio Trend method from the data given below. Year 1st Quarter 2nd Quarter 3rd Quarter 4th Quarter 1987 34 54 38 38 1988 36 60 52 48 1989 40 58 56 52 1990 52 76 64 58 1991 70 90 88 84 22). Obtain an initial basic feasible solution to the following transportation problem by (i). North-west corner rule (ii) Least cost method (iii). Vogel’s approximation methods. Destination/ origin A B C Requirement D E F G 11 16 21 200 13 18 24 225 17 14 13 275 14 10 10 250 **************** 2 Availability 250 300 400
