LOYOLA COLLEGE (AUTONOMOUS), CHENNAI – 600 034
advertisement
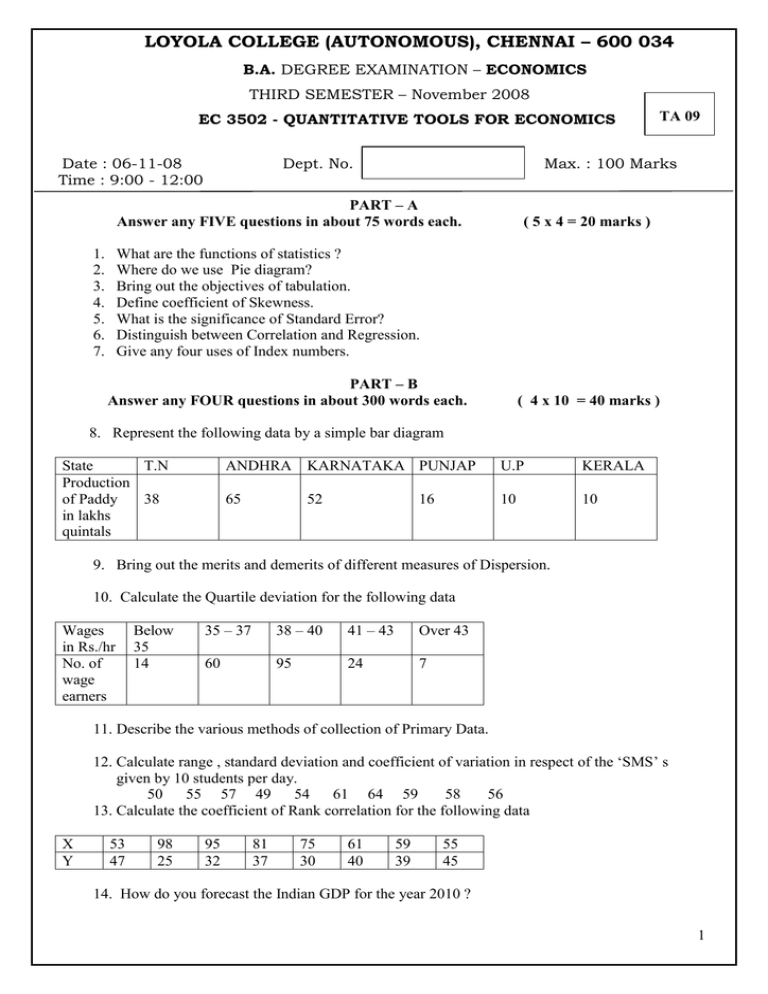
LOYOLA COLLEGE (AUTONOMOUS), CHENNAI – 600 034 B.A. DEGREE EXAMINATION – ECONOMICS THIRD SEMESTER – November 2008 EC 3502 - QUANTITATIVE TOOLS FOR ECONOMICS Date : 06-11-08 Time : 9:00 - 12:00 Dept. No. Max. : 100 Marks PART – A Answer any FIVE questions in about 75 words each. 1. 2. 3. 4. 5. 6. 7. TA 09 ( 5 x 4 = 20 marks ) What are the functions of statistics ? Where do we use Pie diagram? Bring out the objectives of tabulation. Define coefficient of Skewness. What is the significance of Standard Error? Distinguish between Correlation and Regression. Give any four uses of Index numbers. PART – B Answer any FOUR questions in about 300 words each. ( 4 x 10 = 40 marks ) 8. Represent the following data by a simple bar diagram State T.N Production of Paddy 38 in lakhs quintals ANDHRA KARNATAKA PUNJAP U.P KERALA 65 52 10 10 16 9. Bring out the merits and demerits of different measures of Dispersion. 10. Calculate the Quartile deviation for the following data Wages in Rs./hr No. of wage earners Below 35 14 35 – 37 38 – 40 41 – 43 Over 43 60 95 24 7 11. Describe the various methods of collection of Primary Data. 12. Calculate range , standard deviation and coefficient of variation in respect of the ‘SMS’ s given by 10 students per day. 50 55 57 49 54 61 64 59 58 56 13. Calculate the coefficient of Rank correlation for the following data X Y 53 47 98 25 95 32 81 37 75 30 61 40 59 39 55 45 14. How do you forecast the Indian GDP for the year 2010 ? 1 PART – C Answer any TWO questions in about 900 words each. ( 2 x 20 = 40 marks ) 15. Explain the importance of statistics in economic analysis and business decision making. 16. Calculate the Mean , Median and mode for the given data Class 66 - 67 Frequency 15 67 - 68 24 68 – 69 40 69 – 70 20 70 – 71 14 71 - 72 11 17. Estimate the regression equations Yi = a + b Xi and Xi = c + d Yi out the value of Y when X = 30 from the following data Yi Xi 43 25 46 28 49 35 41 32 36 31 32 36 31 29 30 38 33 34 and also find 39 32 18. Calculate fisher’s ideal index number and prove that it satisfy Time reversal and Factor reversal test. Commodity Food Rent Cloth fuel ( QUANTITY ) 2000 -2001 2007 -2008 250 300 100 120 20 30 10 22 ( PRICE ) 2000 – 2001 2007 - 2008 150 130 120 200 600 1000 200 300 *********** 2
