LOYOLA COLLEGE (AUTONOMOUS), CHENNAI – 600 034
advertisement
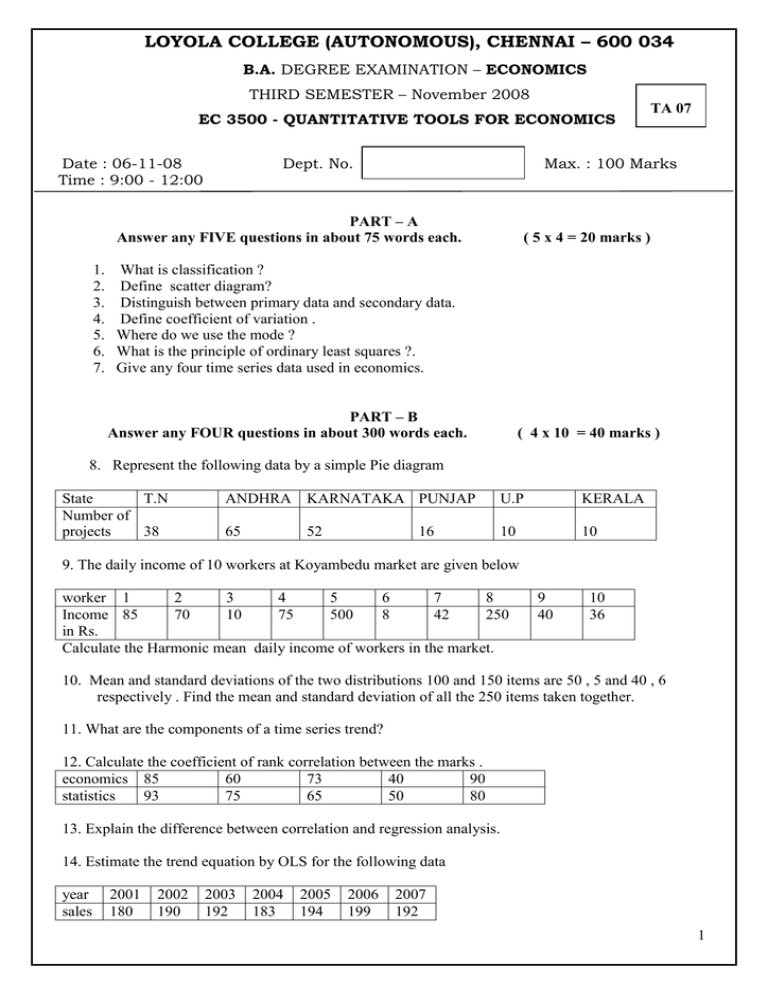
LOYOLA COLLEGE (AUTONOMOUS), CHENNAI – 600 034 B.A. DEGREE EXAMINATION – ECONOMICS THIRD SEMESTER – November 2008 EC 3500 - QUANTITATIVE TOOLS FOR ECONOMICS Date : 06-11-08 Time : 9:00 - 12:00 Dept. No. TA 07 Max. : 100 Marks PART – A Answer any FIVE questions in about 75 words each. ( 5 x 4 = 20 marks ) 1. What is classification ? 2. Define scatter diagram? 3. Distinguish between primary data and secondary data. 4. Define coefficient of variation . 5. Where do we use the mode ? 6. What is the principle of ordinary least squares ?. 7. Give any four time series data used in economics. PART – B Answer any FOUR questions in about 300 words each. ( 4 x 10 = 40 marks ) 8. Represent the following data by a simple Pie diagram State T.N Number of projects 38 ANDHRA KARNATAKA PUNJAP U.P KERALA 65 52 10 10 16 9. The daily income of 10 workers at Koyambedu market are given below worker 1 2 3 4 5 6 7 8 Income 85 70 10 75 500 8 42 250 in Rs. Calculate the Harmonic mean daily income of workers in the market. 9 40 10 36 10. Mean and standard deviations of the two distributions 100 and 150 items are 50 , 5 and 40 , 6 respectively . Find the mean and standard deviation of all the 250 items taken together. 11. What are the components of a time series trend? 12. Calculate the coefficient of rank correlation between the marks . economics 85 60 73 40 90 statistics 93 75 65 50 80 13. Explain the difference between correlation and regression analysis. 14. Estimate the trend equation by OLS for the following data year sales 2001 180 2002 190 2003 192 2004 183 2005 194 2006 199 2007 192 1 PART – C Answer any TWO questions in about 900 words each. ( 2 x 20 = 40 marks ) 15 . Explain the importance of statistics in economic analysis and business decision making. 16. Calculate the Karl Pearson’s coefficient of skew ness Class 0 – 10 Frequency 10 10 – 20 20 – 30 30 –40 40 - 50 40 20 0 10 50 – 60 60 – 70 70 - 80 40 16 14 17. Estimate the regression equations Yi = a + b Xi and Xi = c + d Yi Age of husband and Xi = Age of wife Yi Xi 18 17 19 17 20 18 21 18 22 19 23 19 24 19 25 20 26 21 where Yi = 27 22 18. Calculate fisher’s ideal index number and prove that it satisfy Time reversal and Factor reversal test. Commodity A B C D ( QUANTITY ) 2000 -2001 2007 -2008 12 15 15 20 24 20 5 5 ( PRICE ) 2000 – 2001 2007 - 2008 10 12 7 5 5 9 16 14 *********** 2
