LOYOLA COLLEGE (AUTONOMOUS), CHENNAI – 600 034
advertisement
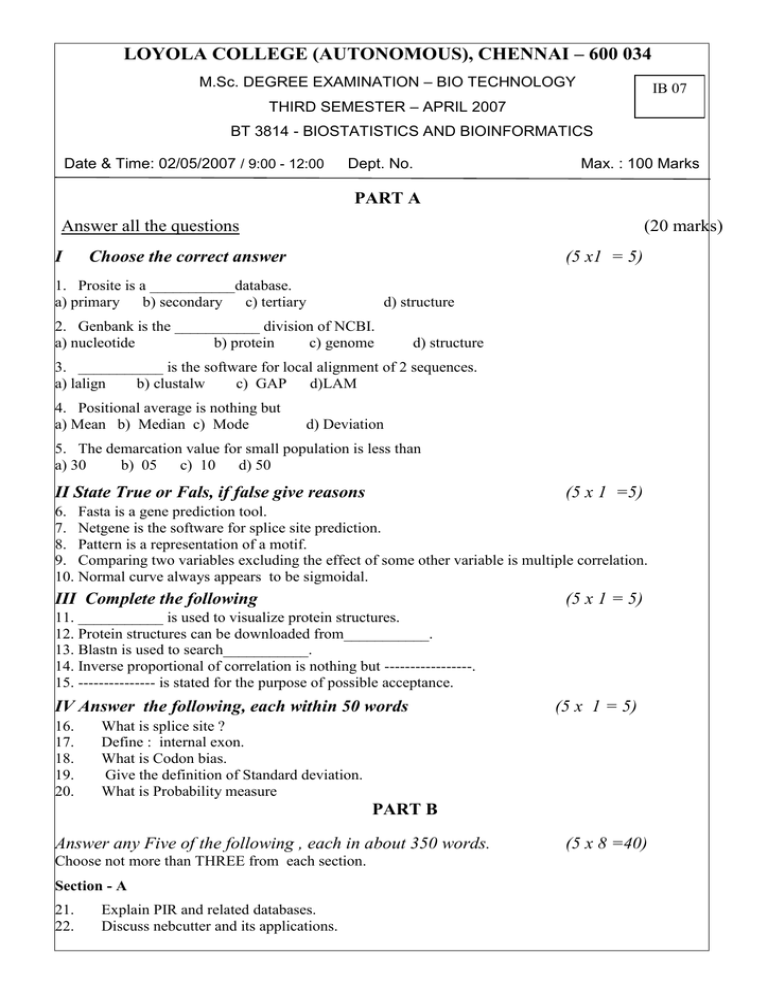
LOYOLA COLLEGE (AUTONOMOUS), CHENNAI – 600 034 M.Sc. DEGREE EXAMINATION – BIO TECHNOLOGY IB 07 THIRD SEMESTER – APRIL 2007 BT 3814 - BIOSTATISTICS AND BIOINFORMATICS Date & Time: 02/05/2007 / 9:00 - 12:00 Dept. No. Max. : 100 Marks PART A Answer all the questions I (20 marks) Choose the correct answer (5 x1 = 5) 1. Prosite is a ___________database. a) primary b) secondary c) tertiary d) structure 2. Genbank is the ___________ division of NCBI. a) nucleotide b) protein c) genome d) structure 3. ___________ is the software for local alignment of 2 sequences. a) lalign b) clustalw c) GAP d)LAM 4. Positional average is nothing but a) Mean b) Median c) Mode d) Deviation 5. The demarcation value for small population is less than a) 30 b) 05 c) 10 d) 50 II State True or Fals, if false give reasons (5 x 1 =5) 6. Fasta is a gene prediction tool. 7. Netgene is the software for splice site prediction. 8. Pattern is a representation of a motif. 9. Comparing two variables excluding the effect of some other variable is multiple correlation. 10. Normal curve always appears to be sigmoidal. III Complete the following (5 x 1 = 5) 11. ___________ is used to visualize protein structures. 12. Protein structures can be downloaded from___________. 13. Blastn is used to search___________. 14. Inverse proportional of correlation is nothing but -----------------. 15. --------------- is stated for the purpose of possible acceptance. IV Answer the following, each within 50 words 16. 17. 18. 19. 20. (5 x 1 = 5) What is splice site ? Define : internal exon. What is Codon bias. Give the definition of Standard deviation. What is Probability measure PART B Answer any Five of the following , each in about 350 words. Choose not more than THREE from each section. Section - A 21. 22. Explain PIR and related databases. Discuss nebcutter and its applications. (5 x 8 =40) 23. 24. Give a schematic representation of Multiple sequence alignment. Discuss any 5 protein structure based analysis. Section - B What are “Measures of central tendency”? Briefly explain their objectives. The following data gives the yield of maize grain (in kg) per plot of size 10 x 4 sq. m. for different doses of nitrogen applications. 25. 26. Amount of N (kg/plot) 20 30 50 90 100 Yield of maize (grain kg) 9.5 12.2 11.4 15.3 16.2 Calculate correlation coefficient and draw your inferences. 27. 28. Write a brief account on the characteristic features of normal distribution. In the garden pea, yellow cotyledon colour is dominant to green and inflated pod shape is dominant to the constricted pod. The F2 progeny appears as 193 Green Inflated 184 Yellow Constricted 556 Yellow Wrinkled 61 Green Constricted Test the data with details for independent assortment using chi-square test. PART C Answer the following, each in about 1500 words. (2 x 20 = 40) Draw diagrams / flowcharts wherever necessary. 29.a) Explain nucleotide sequence collaboration and Genbank file format and add a note on human genome resources and mapviewer. Or b) Explain i) ii) iii) iv) CpG islands Codon usage analysis Codon usage databases Promoter 2.0 30.a) The distribution of energy requirement (in calories) of rabbits in a research institution is given below. Find out the co-efficient of skewness. Energy (in calories) 0-1 1-2 2-3 3-4 4-5 No. of rabbits 2 5 3 6 4 Or b) Gains in weights (kg) of two varieties of sheep (A and B) after feeding a specific food are given below. Test the significance of the difference between mean weight gains of the two varieties. A 49 53 51 52 47 50 52 53 B 52 52 52 53 50 54 54 53 ****** 2
