/hkmw/downloads/3482.doc
advertisement

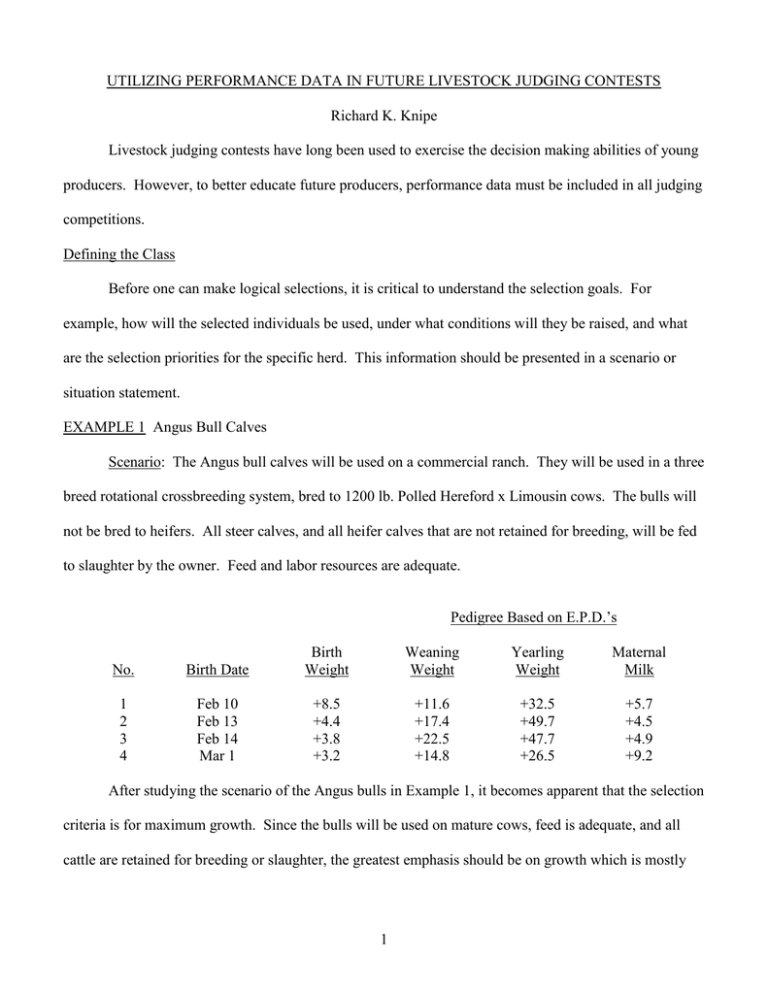
UTILIZING PERFORMANCE DATA IN FUTURE LIVESTOCK JUDGING CONTESTS Richard K. Knipe Livestock judging contests have long been used to exercise the decision making abilities of young producers. However, to better educate future producers, performance data must be included in all judging competitions. Defining the Class Before one can make logical selections, it is critical to understand the selection goals. For example, how will the selected individuals be used, under what conditions will they be raised, and what are the selection priorities for the specific herd. This information should be presented in a scenario or situation statement. EXAMPLE 1 Angus Bull Calves Scenario: The Angus bull calves will be used on a commercial ranch. They will be used in a three breed rotational crossbreeding system, bred to 1200 lb. Polled Hereford x Limousin cows. The bulls will not be bred to heifers. All steer calves, and all heifer calves that are not retained for breeding, will be fed to slaughter by the owner. Feed and labor resources are adequate. Pedigree Based on E.P.D.’s No. Birth Date Birth Weight 1 2 3 4 Feb 10 Feb 13 Feb 14 Mar 1 +8.5 +4.4 +3.8 +3.2 Weaning Weight Yearling Weight Maternal Milk +11.6 +17.4 +22.5 +14.8 +32.5 +49.7 +47.7 +26.5 +5.7 +4.5 +4.9 +9.2 After studying the scenario of the Angus bulls in Example 1, it becomes apparent that the selection criteria is for maximum growth. Since the bulls will be used on mature cows, feed is adequate, and all cattle are retained for breeding or slaughter, the greatest emphasis should be on growth which is mostly 1 accurately measured as yearling weight. Because the bulls will not be used on yearling heifers we do not have to be as concerned with the higher birth weight bulls. In example 1, all performance data is listed as E.P.D.’s (Expected Progeny Difference). Beef cattle E.P.D.’s are expressed in pounds as the expected performance of the progeny of that individual differs from the breed average. For example, we would expect the calves from bull 1 to be 2.1 pounds heavier at birth than calves sired by bull 2 and be 17.2 pounds lighter as yearlings. When we analyze the data in Example 1, we find bulls 2 and 3 to be the highest growth bulls due to their superior yearling weight E.P.D.’s. Bull 1 has average performance, however if he was to be used on yearling heifers his high birth weight would probably place him last in class. Bull 4 has the poorest growth performance data, however if you are looking for a bull to develop a heavy milking cow herd he would be the best bull in this class. Traditional swine breeding classes included days to 230 pounds, backfat at 230 pounds, and S.P.I. (Sow Productivity Index). These traits are still very important, however, the swine industry has recently introduced E.P.D.’s for these traits. Example 2 shows the type of data that will be presented at future contests. It is important to carefully study the data, because it does differ from the beef cattle data. The E.P.D. for pigs born alive predicts the litter size for each individual’s progeny in number of pigs. In Example 2, gilt 1’s progeny would be expected to produce 0.5 live pigs per litter more than the progeny of gilt 2. The E.P.D. for litter weight is given in pounds and as you can see gilt 1 is expected to produce progeny that will produce litters that are 6.0 pounds heavier at 21 days of age when compared to gilt 3. The best indicators of growth rate and leanness are the E.P.D.’s for days to 230 pounds and backfat respectively. It is important to note that for these two traits a negative number is more desirable than a positive number. In example 2, gilt 3 would be expected to produce the fastest growing and leanest progeny. When comparing growth, gilt 3’s offspring should reach 230 pounds 7.3 days sooner than gilt 1’s pigs and be .2 inches leaner. 2 The gilt that you select in Example 2 is dependent on the selection goals. For example, if you are looking for a gilt to produce terminal sire boars and you are only interested in growth and leanness you would select gilt 3. However, if you are looking for a gilt to produce maternal line gilts you would select gilt 1. On the other hand, gilt 2 would probably be your selection if you are looking for a balance of traits such as in a three breed rotational cross. EXAMPLE 2 E.P.D.’s Gilt No. Pigs Born Alive 21 Day Weight Days To 230 Backfat Thickness SPI 1 2 3 1.0 0.5 0.1 4.7 2.5 -1.3 3.2 0.4 -4.1 .1 .0 -.1 108.1 104.2 101.0 Flock Expected Progeny Differences (F.E.P.D.) will be given on breeding ewe classes in the future. Table 1 is an example that was used in the 1989 National 4-H Livestock Judging Contest. TABLE 1 F.E.P.D.’s Ewe No. Birth Date 90 Day Weight Maternal Lambs Born Maternal Pounds Weaned Grease Fleece Weight 1 2 3 4 2/10 2/10 2/14 2/16 +2.7 +6.1 +6.0 -4.2 +.03 +.18 +.11 +.26 .4 .9 .7 -.7 +.5 -.1 +.5 +.5 How you use this data depends on the goals of the farm. For example, if the breeder is in the business of producing seed stock for a terminal crossbreeding program, then selection would emphasize growth traits such as 90 day weight. In this case, ewes 2 and 3 would be selected and 4 would be last in class. On the other hand, if we are trying to increase multiple births, then 4 has the best data because she has the highest F.E.P.D. for Maternal Lambs Born. If wool sales contribute significantly to the profitability of the operation, then you place the number 2 ewe lower in class. 3 Often the given scenario (farm goals) emphasize a balance of traits. In this example, 2 and 3 ewe have very similar data, with the 3 ewe having an advantage in pounds of wool. Therefore, unless wool production is emphasized, ewes 2 and 3 would start the class and be placed on visual traits. Performance data should be used in judging contests at all contest levels (county, state, and national). However, use of the data is of little value if the judges are not given the goals of the operation. SUMMARY At one time, livestock was selected by visual appraisal alone because nothing better was available. Fortunately, evaluation techniques have improved, and so visual appraisal can now be used as an aid to the more accurate performance selection. Difference in composition, frame size, muscle expression, structure, and abnormalities can be determined visually, after the main decisions have been made on performance data. Remember that there are no clear guidelines on placing classes, even though performance records are included. In fact, including weights and breeding values can create more ways to justify alternate decisions. The records may even be contradictory to the results of visual appraisal alone. However, these contradictions can provide a marvelous opportunity to discuss various producer goals and how alternative selection practices can be used to reach them. S:\ds\youth\livestock judging fact sheet 4


