Faculty 2013 ROA Online System – tips and template
advertisement
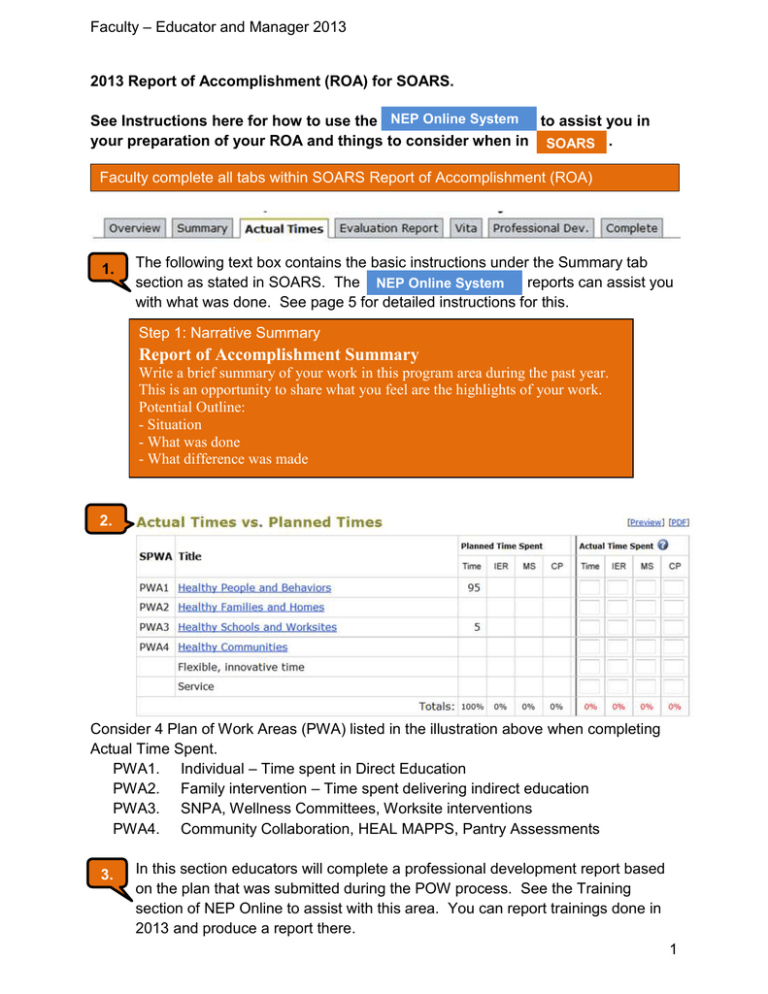
Faculty – Educator and Manager 2013 2013 Report of Accomplishment (ROA) for SOARS. See Instructions here for how to use the NEP Online System to assist you in your preparation of your ROA and things to consider when in SOARS . Faculty complete all tabs within SOARS Report of Accomplishment (ROA) : 1. The following text box contains the basic instructions under the Summary tab section as stated in SOARS. The NEP Online System reports can assist you with what was done. See page 5 for detailed instructions for this. Step 1: Narrative Summary Report of Accomplishment Summary Write a brief summary of your work in this program area during the past year. This is an opportunity to share what you feel are the highlights of your work. Potential Outline: - Situation - What was done - What difference was made 2. Consider 4 Plan of Work Areas (PWA) listed in the illustration above when completing Actual Time Spent. PWA1. Individual – Time spent in Direct Education PWA2. Family intervention – Time spent delivering indirect education PWA3. SNPA, Wellness Committees, Worksite interventions PWA4. Community Collaboration, HEAL MAPPS, Pantry Assessments 3. In this section educators will complete a professional development report based on the plan that was submitted during the POW process. See the Training section of NEP Online to assist with this area. You can report trainings done in 2013 and produce a report there. 1 Faculty – Educator and Manager 2013 Unit Reports from the NEP Online System are available to those in manager roles: In a manager role, you will see many more reports than those in the Educator Role. 1. Contacts by Ethnicity for SOARS Report a. Data labeled as Direct are from series of sessions and single sessions and will list with the “OSUES lead person for this group” b. Data labeled Indirect are only for Public Events and will list with the “OSUES staff person who is responsible for event.” Note: This will look different than statistics in the ROA Detail as that report pulls statistics from the Staffing area within the education record. See sample with #3. Login to NEP Online System Click on Reports on left side of home page Be sure to select the 2013 Fiscal Year as the system defaults to 2014. 1. Select this report first with a left click. Left click on “Open with” to see the file. The file will appear as a CSV type. Your first action is to do a “Save as” an Excel Workbook in a location of your choice.. The next 2 pages give explanations regarding the data in this report and what is needed for SOARS. Read this first to understand the source of the data in this report and how it relates to SOARS . 2 Faculty – Educator and Manager 2013 Use of NEP Online System to help report contacts in SOARS 2013 SOARS SOARS Education Contacts are interactions with people. There are four types: 1. Direct Individuals - Contacts that are made directly with individuals through Extension programming. (e.g. face-to-face meetings, telephone consultation, or email responses that involve educational content or solutions). a. “Direct Individuals” is the Contact Type to select in SOARS. b. OSUES Staff persons entering indirect contacts (not made by volunteers) Enter in SOARS selecting another “Direct Individuals”. This means you will have 2 “Direct Individuals” entries in SOARS. NEP Online System Data for this SOARS Reporting is found in NEP Online in the “Ethnicity for SOARS” Reports – Generate this report only one time each year after all data is in. In the Ethnicity for SOARS Report, the data only represents face-to-face meetings. See “Direct” in the Contact Type column D. All “Direct” numbers are summarized and shown in one row by program for each person who was listed in NEP Online as a Lead person. The source of the numbers is the “OSUES Lead Person for a group”. These numbers include all extended delivery done by teachers (Community Staff Extenders). The “Indirect” numbers shown next to your name may not reflect contacts made by volunteers but rather made by you, an OSUES Staff person. In that case, follow the instructions here to the left under b. To see the detail and full staffing related to these numbers, produce a Public Event report in NEP Online under the Education Detail area. In the Ethnicity for SOARS Report produced in the NEP Online System, the data that is indicated as “Indirect’ is for Public Events only and not for Displays or Ed Materials sent to home or site. All “Indirect” numbers are summarized and shown in one row for each OSUES staff person and program. The source of these numbers is the “OSUES staff person who is responsible for event” listed in each Public Event. 2. Indirect Volunteers - Contacts that are made indirectly through trained Extension Volunteers. If you are reporting numbers for indirect contacts made by volunteers, select the “Indirect Volunteers” Contact Type. If you supervised Volunteers in the delivery of Public Events, their numbers are shown next to your name (as the person responsible for the event) in the rows marked “Indirect” in the NEP Online Ethnicity for SOARS Report. You will see portions of these numbers in the individual ROA reports for Volunteers. You will not see in the ROA Unit Detail All OSUES Persons. 3 Faculty – Educator and Manager 2013 SOARS 3. Media - Contacts made through the media (e.g newspaper articles in which case the readership for the paper is counted). 4. Other - includes website "sessions" or "visitors" (not "hits") NEP Online System These types of contacts are not generally tracked in the NEP Online System. These types of contacts are not tracked in the NEP Online System. If you do not train or supervise volunteers, go to page 5. If you do, proceed here: In SOARS, add number of New Trained Volunteers in 2013 Enter the number of volunteers who receive specific training for the work they do with Extension. Examples include 4-H Leaders, Master Gardeners, etc. Training Volunteers to assist with education delivery in SNAP-Ed would go here. Report here the total number of new volunteers during 2013. The total individuals trained during the year will be reflected in the “Extension Volunteers” section of SOARS ROA Narrative “What will be done and who will be reached?” In SOARS, add number of Other New Volunteers in 2013 Enter the number of volunteers who assist with Extension programming but do not receive special training in order to fulfill their volunteer roles. Examples include infrequent volunteers who staff information tables, or help set up for an event. Volunteers who help in NEP Offices go here. Your name The total numbers of Volunteers who help in NEP Offices go under Other Volunteers. 4 Faculty – Educator and Manager 2013 Back to the NEP Online System Follow these instructions to reformat the “Contacts by Ethnicity” report for readability. 1. Select All Cells - left click in the upper left corner cell. Select all cells Text area will turn blue To Wrap Text, right click the mouse within the blue part of the workbook and then left click to select “Format Cells” from the temporary menu. a. Left click on the “Alignment” tab. b. Left click “Wrap text” (about midway down the page). c. Left click “OK.” The display in the workbook will now show all information entered into each cell. Entry of contacts into SOARS is straight forward for each educator from this report. Back to the NEP Online System - Reports 2. Produce your individual “ROA Detail by OSUES Person” to prepare your ROA summary. See to the right of the report menu. It lists all of the statistics where you were listed as a staff person in the record. 1. Save the file as an Excel Workbook a. Select the office button, (top left corner of screen). b. Hover over “Save As” and left click Excel Workbook c. Choose location for the document. d. Name and date the file e. Left click “Save”. If you no longer need help with formatting, go to the middle of Page 8. 2. Wrap Text - Follow the instructions at top of this page to reformat the report by wrapping text for readability. 5 Faculty – Educator and Manager 2013 3. Delete Rows - You must delete row 1 in order for other formatting functions to work. The title of your report will remain as the document name at the top of the screen. Next delete the blank row 2 in this report document. a. Right Click in the row number cell. b. Left click “Delete” c. Repeat this for any blank row that is between data rows. 4. Freeze Top Row (Keeps the top title row as you scroll through report rows) a. Left click on the row number cell in row 1 to highlight the row. (This should be the row with your column titles. If not, return to instruction #3 and 4). b. Left click the “View” tab from the main menu bar. c. Left click “Freeze Panes” down arrow. d. Left click “Freeze Top Row”. 5. Individual Column Width Adjustment (Helps readability) a. Place the cursor on the horizontal line between two column letter headings and to the right of the column you wish to resize (i.e., the line between columns A and B will adjust the width of column A). b. Left click, hold and drag the column to the desired width. c. Repeat for columns with cells that have a lot of words (for example, the Agency, Education Delivery Location, Audience Type, and Group Name). 6. AutoFit Row Height (useful once you have expanded column widths) a. Select all cells by left clicking in the upper left corner cell. b. Left click on the Home tab from the main menu bar. c. Left click on the Format Cells drop down arrow. d. Left click on AutoFit Row Height 7. Sort The Data a. Select all cells by left clicking in the upper left corner cell. b. Left click on the Data tab from the main menu bar. c. Left click on Sort icon. d. In the pop-up, look to the right and Left click My data has headers e. Select a “Sort by” column. (Best to first to sort by Education Delivery Location/Site) f. Note: You must not be using a filter when you want to use the Sort function. See instruction #11 “To Remove Filters” prior to sorting. 8. Expand The Size Of The View a. In the lower right corner of the Worksheet are controls. b. Left click on to increase the size. 6 Faculty – Educator and Manager 2013 9. Set-up Filtering In Title Row (This will help with project data filtering.) a. Select all cells by left clicking in the upper left corner cell. b. Left click on the “Data” tab from the main menu bar. Left click “Filter.” c. Drop down menu arrows have now been added to each column heading. d. To apply a filter, left click on the drop down menu arrow in the Project Areas, Column P. This is useful when trying to summarize data by project area for the ROA narrative summary. e. Left click on the (Select all) to deselect the entire set of data. f. Left click on the desired filter criteria for the column selected. An example is to left click on anything in the list with a 4 indicating Adults all Ages and Youth All Ages Project Area listings. g. Left click “OK”. See only the data that has a 4 selected. To go back, click on select again. Left click “OK” again to see all data. 10. To Remove Filters a. Select all cells by left clicking in the upper left corner cell. b. Left click on the “Data” tab from the main menu bar. c. Left click “Filter.” Drop down menu arrows have now been removed from each column heading. 7 Faculty – Educator and Manager 2013 11. Set-up Summing Using Filters a. Make note of the first group name appearing in row 2 of the report. b. Apply Filter to selected column titled “Group Name” by left clicking on the drop down menu arrow. c. In the drop down menu, left click on the (Select all) to deselect the entire set of data. d. Then left click on the first “Group Name” in the drop down menu. If the site is not the same as in row 2, then go back and Sort by site name and begin the filtering again. If you sum the first selected site, then sums will be available under all filtering situations. Drop down menu arrow e. Left click f. Left click the Formula tab from the main menu bar. g. Left click in the cell just below first column that has numbers. (Column L, # of sessions) e. h. Left click on AutoSum, then “Enter” key on your keyboard. f . h. g. i. Bold the text in the total cell (Go to Home tab and click ) 8 Faculty – Educator and Manager 2013 j. Move curser to the lower right corner of the total cell until a black plus sign appears. k. Left click on the black plus sign and drag from that cell through to the end of data sum cells. Then let go. Totals should appear to the right. Delete the totals in columns that are not needed (such as key messages). Additional filter icon l. Now, go back to the Group column filter and left click on the additional filter icon. m. In the drop down menu, left click on the (Select all) to select the entire set of data. n. Left click o. Once you do the above, the summing totals will work for all rows of data. p. You can now filter for specific data and have totals for that data (For example, filter up a specific site and see all totals for that site). General Tip: Remember to left click on the save icon frequently while you are reformatting report documents. Save icon 9 Faculty – Educator and Manager 2013 Now that you have prepared and reformatted reports from the Nep Online System, it is time to prepare a narrative summary in this Word file. When this summary is complete, you will copy and paste the finished text into SOARS Find the information in your ROA report from NEP Online and copy and paste to fill in the blanks in the template sentences here as often as needed for the various audiences listed below and the types of sites you are reporting on. Consolidate and summarize the data. Prepare the total ROA narrative draft in this document, then copy and paste the full narrative into SOARS. Narrative Summary (Template for SOARS) Describe the staff make-up of your unit that carried out the 2013 SNAP-Ed Program Education in the beginning of your narrative in this section. Copy and paste the following statement to inform the reader what time period your information represents: This summary reflects my work during the federal fiscal year (FFY) 2013 (October 1, 2012 – September 30, 2013) Create a summary for each program that applies to your work. Use filter in Column Select a Program to title the section: P of your “ROA SNAP-Ed Program Education Delivery Detail” report to EFNEP Program Education Delivery summarize data for SNAP-Outreach Program each Project Area. PWA1. Healthy People and Behaviors Individual – Time spent in Direct Education (Indirect is found under PWA2) A. Healthy Eating and Activity Project Area 1 Focus: Families - Pregnant and Parenting Teens. I used Curricula at Site(s). I presented sessions to groups, reaching participants, resulting in direct education contacts. Project Area 2 Focus: Families – Parents and other adults, Adults – all ages. I used Curricula at Public Housing Sites. I presented sessions to groups, reaching participants, resulting in direct education contacts. Project Area 2 Focus: Families, Adults – Disabled. I used Curricula at Community Sites. I delivered sessions to groups, reaching direct education contacts. participants, resulting in Project Area 4 Focus: Families - Adults all ages with youth all ages. 10 Faculty – Educator and Manager 2013 I used Curricula at Public School Sites. I presented sessions to groups, reaching direct education contacts. participants, resulting in Project Area 5 Focus: Families – English Language Learners. I used Curricula at Public School Sites. I presented sessions to groups, reaching participants, resulting in direct education contacts. Project Area 8: Seniors – Older Adults (60+). I used Curricula at Senior Center Sites. I presented sessions to groups, reaching direct education contacts. participants, resulting in Project Area 12: Youth - In School - Pre Kinder and Kinder: I used: Curricula at Public Schools, (3 Public Schools) I presented sessions in classrooms, reaching participants, resulting in direct education contacts. or I used: Curricula at Public Schools, (3 Public Schools) I presented sessions in classrooms and trained teachers presented some of these sessions extending the reach to a total of participants, resulting in direct education contacts. Project Area 13: Youth - In School – 1st and 2nd Grade: I used: Curricula at Public Schools, (3 Public Schools) I presented sessions in classrooms, reaching participants, resulting in direct education contacts. or I used: Curricula at Public Schools, (3 Public Schools) I presented sessions in classrooms and trained teachers presented some of these sessions extending the reach to a total of participants, resulting in direct education contacts. Project Area 14: Youth - In School – 3rd through 5th Grade: I used: Curricula at Public Schools, (3 Public Schools) I presented sessions in classrooms, reaching participants, resulting in direct education contacts. or I used: Curricula at Public Schools, (3 Public Schools) 11 Faculty – Educator and Manager 2013 I presented sessions in classrooms and trained teachers presented some of these sessions extending the reach to a total of participants, resulting in direct education contacts. Project Area 15: Youth - In School – Middle School (6,7,8 Grade): I used: Curricula at Public Schools, (3 Public Schools) I presented sessions in classrooms, reaching participants, resulting in direct education contacts. or I used: Curricula at Public Schools, (3 Public Schools) I presented sessions in classrooms and trained teachers presented some of these sessions extending the reach to a total of participants, resulting in direct education contacts. Project Area 16: Youth - In School – Mixed Grades and Ages: I used: Curricula at Public Schools, (3 Public Schools) I presented sessions in classrooms, reaching participants, resulting in direct education contacts. or I used: Curricula at Public Schools, (3 Public Schools) I presented sessions in classrooms and trained teachers presented some of these sessions extending the reach to a total of participants, resulting in direct education contacts. Project Area 17: Youth - In School – High School I used: Curricula at Public Schools, (3 Public Schools) I presented sessions in classrooms, reaching participants, resulting in direct education contacts. or I used: Curricula at Public Schools, (3 Public Schools) I presented sessions in classrooms and trained teachers presented some of these sessions extending the reach to a total of participants, resulting in direct education contacts. Project Area 16: Youth - Afterschool – Mixed Grades and Ages: I used: Curricula at Public Schools, (3 Public Schools) I presented sessions to groups, reaching participants, resulting in direct education contacts. Project Area 16: Youth – Summer Programs – Mixed Grades and Ages: I used: Curricula at Public Schools, (3 Public Schools) 12 Faculty – Educator and Manager 2013 I presented sessions to direct education contacts. groups, reaching participants, resulting in PWA1. Healthy People and Behaviors (Continued) B. Food Safety/Food Preservation Food Safety education is included in all NEP delivery involving food. C. Volunteer Programs Project Area 10: Train the Trainer - Volunteers At the OSU Extension office, I presented education sessions to train volunteers resulting in who went on to reach the target audience at community sites with SNAP-Ed educational messages and food tastings. Trainings resulting in direct education contacts with volunteers. SNAP-Ed Volunteer contributions: Hours reported for FFY2012 Prep and clean- Education Extended Education up Hours Delivery Hours Delivery by trained Total Extension Volunteers Hours Total FTE This reflects time efforts to prepare for and assist with direct education delivery and to staff public events. See the Volunteer Staff report in the Online System to find this data for your Unit. Project Area 11: Train the Trainer - Community Staff (Extenders) At Public School sites, I presented education sessions to train teachers who extended SNAP-Ed lessons to youth. Trainings resulting in direct education contacts with school personnel. SNAP-Ed Community Staff contributions: Hours reported for FFY2012 Prep and clean- Education Extended Education up Hours Delivery Hours Delivery by trained Total teachers in schools Hours Total FTE This reflects time efforts to prepare for and assist with direct education delivery and/or extend sessions using SNAP-Ed materials and to staff public events. See the Community Staff report in the Online System to find this data for your Unit. PWA2. Healthy Families and Homes (Indirect Delivery) Family intervention – Time spent delivering indirect education Create a summary for each program that applies to your work. Select a Program to title the section: SNAP-Ed Program Education Delivery EFNEP Program Education Delivery You will need to produce other reports to come SNAP-Outreach Program up with Unit data for “Education Materials sent 13 to site” or Public Displays as these methods of indirect education do not include staffing so this Faculty – Educator and Manager 2013 Project Area 2 Focus: Families – Parents and other adults, Adults – all ages. Education materials were sent home with the youth reaching at least adults in the home resulting in indirect contacts. The reason data for “Education materials sent to home” is found in the ROA Detail by OSUES Person reports. This data line is automatically produced when the Yes is checked in a NEP Online session and then shows up in this report. This is why you will not see a project number listed. Rather, use the filter to summarize data by “Delivery Type” for this template sentence. Report the Unit total for all of this data in the template sentence above. This data is also available in the Education Process Evaluation Detail report. Reformat additional report(s) in order to use summing and filters to compile data. At WIC sites, I sent materials to the office reaching individuals. Project Area 4 Focus: Families - Adults all ages with youth all ages. At Public School sites, I provided face to face educational contacts at Public Event(s) reaching participants. At Food Pantry sites, I provided face to face educational contacts at Public Event(s) reaching participants. At Head Start sites, I set up displays reaching individuals. Project Area 12: Youth - In School - Pre Kinder and Kinder: Project Area 13: Youth - In School – 1st and 2nd Grade: Project Area 14: Youth - In School – 3rd through 5th Grade: Project Area 15: Youth - In School – Middle School (6,7,8 Grade): Project Area 16: Youth - In School – Mixed Grades and Ages: Project Area 17: Youth - In School – High School: At Public School sites, I set up displays reaching individuals. At Public School sites, I sent materials to the school reaching individuals. At Public School sites, I provided face to face educational contacts in the lunch room at Public Event(s) reaching participants. 14 Faculty – Educator and Manager 2013 PWA3. Healthy Schools and Worksites SNPA, Wellness Committees, Worksite interventions Locally, needs were determined while meeting with community collaboration partners. Describe briefly if this applies to you. PWA4. Healthy Communities Community Collaboration, HEAL MAPPS, Pantry Assessments Describe briefly if this applies to you. After you have used portions of the template to fill in information based on the report of your effort by project area, finish by editing the list of the education delivery for the federal fiscal year into a readable format that makes sense to you. Summarize and consolidate the information as much as possible. Copy and paste into SOARS. Evaluation Report See file named Faculty ROA Evaluation and Impact Reports Professional Development Check out the User Training Report in the Online System to see if any of this information is useful in reporting your Professional Development in SOARS. To Wrap Text, right click the mouse within the blue part of the workbook and then left click to select “Format Cells” from the temporary menu. k. Left click on the “Alignment” tab. l. Left click “Wrap text” (about midway down the page). m. Left click “OK.” The display in the workbook will now show all information entered into each cell. For questions, concerns, and assistance with this process of using NEP Online to assist you with SOARS entry, please call or email Jill Mills at: Jill.Mills@oregonstate.edu 541-737-8839 (Campus office) or 541-870-5413 (cell) 15
