Math 110 Term Project: Data Analysis with Functions
advertisement
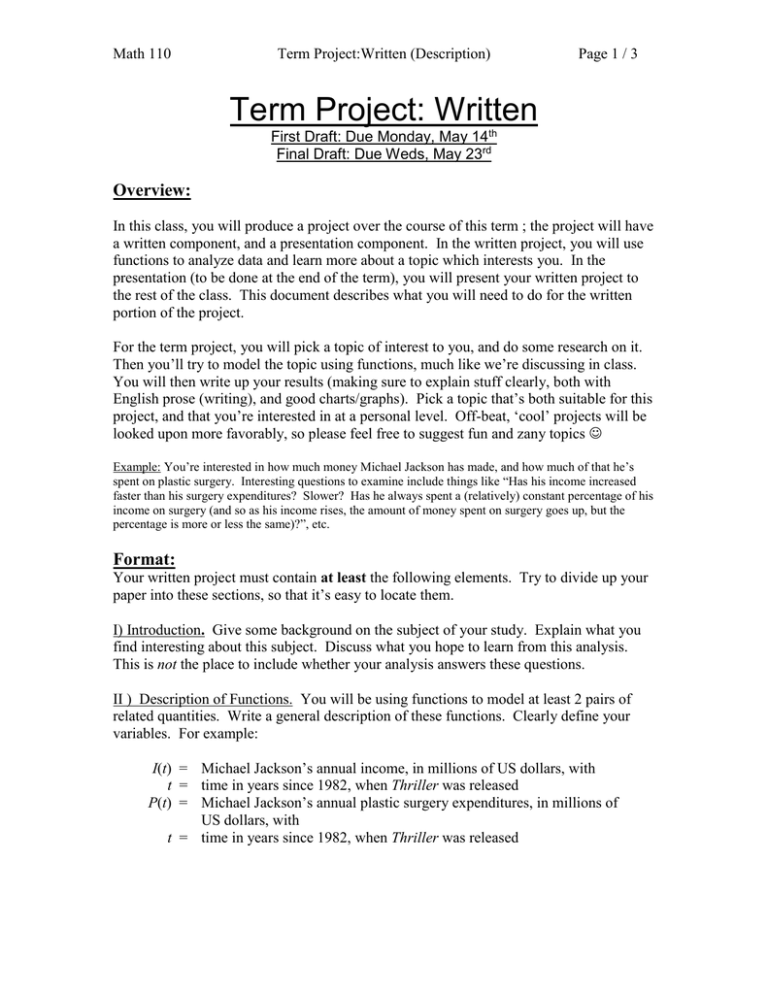
Math 110 Term Project:Written (Description) Page 1 / 3 Term Project: Written First Draft: Due Monday, May 14th Final Draft: Due Weds, May 23rd Overview: In this class, you will produce a project over the course of this term ; the project will have a written component, and a presentation component. In the written project, you will use functions to analyze data and learn more about a topic which interests you. In the presentation (to be done at the end of the term), you will present your written project to the rest of the class. This document describes what you will need to do for the written portion of the project. For the term project, you will pick a topic of interest to you, and do some research on it. Then you’ll try to model the topic using functions, much like we’re discussing in class. You will then write up your results (making sure to explain stuff clearly, both with English prose (writing), and good charts/graphs). Pick a topic that’s both suitable for this project, and that you’re interested in at a personal level. Off-beat, ‘cool’ projects will be looked upon more favorably, so please feel free to suggest fun and zany topics Example: You’re interested in how much money Michael Jackson has made, and how much of that he’s spent on plastic surgery. Interesting questions to examine include things like “Has his income increased faster than his surgery expenditures? Slower? Has he always spent a (relatively) constant percentage of his income on surgery (and so as his income rises, the amount of money spent on surgery goes up, but the percentage is more or less the same)?”, etc. Format: Your written project must contain at least the following elements. Try to divide up your paper into these sections, so that it’s easy to locate them. I) Introduction. Give some background on the subject of your study. Explain what you find interesting about this subject. Discuss what you hope to learn from this analysis. This is not the place to include whether your analysis answers these questions. II ) Description of Functions. You will be using functions to model at least 2 pairs of related quantities. Write a general description of these functions. Clearly define your variables. For example: I(t) = Michael Jackson’s annual income, in millions of US dollars, with t = time in years since 1982, when Thriller was released P(t) = Michael Jackson’s annual plastic surgery expenditures, in millions of US dollars, with t = time in years since 1982, when Thriller was released III ) Collection of Data. You will construct these functions using the regression methods discussed in class. Collect at least 20 data points to use for each function. In the example above, data points are pairs of the form (year, dollar amount) You need to gather data from at least two reliable sources. You should clearly list these sources, and offer a brief explanation as to why you think the source is reliable. Does the source clearly explain where it got it’s data from? Is the source generally trusted (the government, a respected newspaper or magazine (The New York Times, The Wall Street Journal, CNN.com, etc)? An explanation is especially important if you get data from a website, and doubly so if that website isn’t a widely-recognized website. If you decide that you’d like to gather data yourself (e.g., by doing a survey of your fellow students), you need to TALK TO THE INSTRUCTOR FIRST. There are actually a number of rules that need to be followed to make sure that neither you, nor the College, gets in trouble. IV) Construction of function. Use regressions to find the best fit linear function, quadratic function, and cubic function to describe your data. Which is the best fit? If none of these fit well (r2 < 0.8 for all three) talk with me about whether you should try another type of function. Make sure to include scatter plots, and graphs/charts that demonstrate which function is best. Hint: If you’re dealing with time data (for example, you gather the number of AIDs in a given year, from 1983 to 1994, it’s often best to say that your first year is “year 0” (1983 in this case), and count upwards from there (1984 is year 1, etc). This way, the coefficients on the function you find should be smaller, and a better reflection of the underlying behavior. V) Analysis. Use your skills from this quarter to analyze your data. This analysis should include the following at a minimum: 1. Identify the domain and range of your functions. What values can legally be used as input into the formula of each function? What values of the function can be obtained as a result? Are there any physical restrictions on the domain and range of your functions? 2. Create a graph of each of your functions. Be sure to clearly label your axes and all points of interest. 3. Find all local maxima and minima of your functions. Where do they occur? What do these points represent? 4. Find all zeros of your functions. Where do they occur? What do these points represent? 5. Analyze the long term behavior of your functions. Does it make sense? If not, where do you expect your function to stop being a good model? Why do you think that will happen? VI) Discussion. What conclusions can you draw about your topic using what you have learned about these functions? Do these results surprise you, or do they confirm your previous beliefs? What have you learned from this analysis? What factors might contribute to the relationships you have discovered by using functions? VII) Conclusion. Summarize your results. Consider any implications of your conclusions. What questions does your work suggest for future analysis? Keep in mind that each section should be written in a prose format – it’s not enough to simply copy this document, and replace each of the above paragraphs with your ‘answer’ for each area. You want someone who’s never taken a Cascadia math class (but who has taken pre-calculus elsewhere) to be able to pick up your report, read it, and understand it fully, even without them reading this document (i.e., without them reading the assignment) Group Work: You will in groups on this project. Each group should have 4 (or, in some rare circumstances, 3) people. While you’re free to work with whoever you like, keep in mind that you’ll all be working on the same project (so work with people who want to do the same thing as you), and if a group member stops contributing, you’ll still need to finish the project on your own (so pick people you trust ). Submitting Your Project / Grading: Your first draft must be submitted, neatly typed, at the beginning of class on Monday, May 14th . If you choose to revise your first draft, then your final draft is due at the beginning of class Wednesday, May 23rd. For both of these dates, if you turn in the project late, each day (or fraction of a day) late will incur a penalty of 5 points (10%). When you submit your project, make sure that it includes a (required) cover sheet. Each group member must sign the cover sheet of the report in order to receive credit for the project. If a group member doesn’t sign the sheet, then it will be assumed that the group member didn’t contribute to the project, and will be assigned a grade of 0 for the written portion of the project. Your results must contain at least the above elements (listed under “The Details”). These are the basic requirements to receive a 45 on your project. The remaining 5 points of your score will be based on using creativity to go beyond the minimum requirements. Please see the attached rubric for more information on how you’ll be graded. Once you have submitted your first draft, it will be graded, and the grade (and feedback) returned to you. If you wish, you may revise your first draft, and submit it again (by the date listed at the start of this project). The higher grade (between the first and final drafts) will be used as your final grade for this project.
