DNA electrophorases.pptx
advertisement
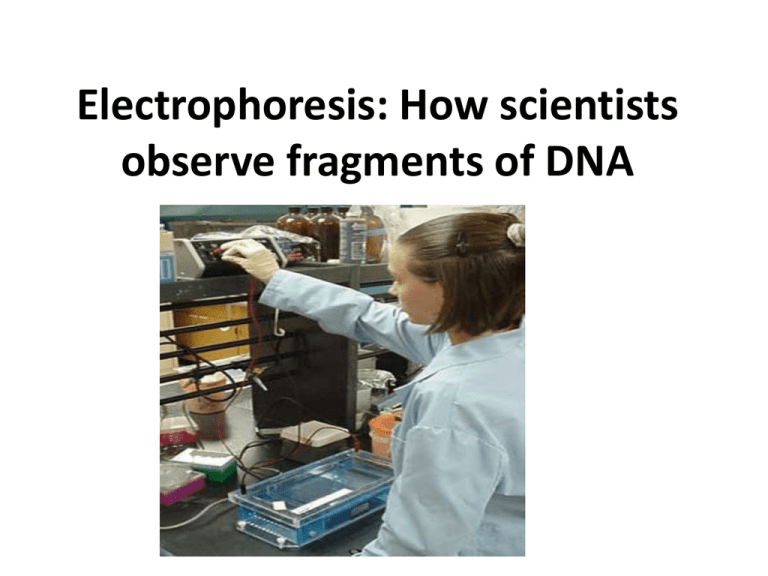
Electrophoresis: How scientists observe fragments of DNA Electrophoresis Introduction How do scientists look at DNA? As genetic analysis has become more precise, the average person may get the impression that modern geneticists have powerful microscopes in their labs that zoom in on the DNA molecule and reveal information. Fans of “Star Trek” television reruns will envision devices that are waved over tissue and produce meaningful DNA data. In reality, DNA analysis techniques reveal information by using a more indirect method of looking at the molecule. Electrophoresis is the central technique in this analysis. Electrophoresis means to carry with electricity. The technique allows scientists to detect sequence variation among specific DNA segments based on how fast these segments are carried by electricity. There are two key facts that allow this technique to work. 1) Nucleotide sequence differences in one DNA segment compared to another can result in size differences in these segments. 2) Longer segments of DNA will be carried through the gel more slowly than shorter segments. Speed comparisons bring to mind a race, so let’s think about electrophoresis using a racing analogy. Electrophoresis gels: the race track You need a track if you’re going to race and the electrophoresis gel is the molecular race track. The track is a gel matrix that is similar to a slab of gelatin. The electrophoresis gel is made by adding a powdered substance such as agarose (Fig. 1) to water, bringing the water to a boil, and then allowing the solution to cool. Agarose will form a gel matrix as it cools, conforming to the shape of the container or mold. The matrix will have spaces that are filled with the water. The size of these spaces depends upon the concentration and physical properties of agarose. Change the concentration or switch to a different substance (acrylamide for example) and you alter the size of the holes or spaces in the matrix. Therefore, a matrix made from agarose and water is the race track used to compare the speed of DNA from different samples. Fig. 1. Agarose powder used to make an electrophoresis gel. Fig. 2. Measuring the correct amount of agarose Current is the key Several differences distinguish the electrophoresis gel (our DNA race track) and a slab of gelatin you would eat for desert. The water used to make the gel has electrolytes in it to conduct current. This water plus electrolytes solution is called an electrophoresis buffer. An agarose gel is made of complex carbohydrates extracted from seaweed and is not sweet to eat. The matrix creates the right size spaces for sieving DNA and holds it's shape even if it heats up when electric current is run through it. Finally, the electrophoresis gel is placed in an electrophoresis apparatus or gel box that is designed to hold the gel in place and conduct a current through it. Preparing a gel The first step in gel preparation is to weigh out the appropriate amount of agarose (Fig. 2). This amount depends on the size of the gel and the size of the DNA segments being separated. Smaller segments will require separation with a more dense electrophoresis gel. The agarose is poured into the water solution with the electrolyte (Figs. 3,4). Usually the electrolyte solution such as Tris borate EDTA is made as a concentrated stock and them diluted for each gel. The agarose and electrolyte solution is then heated and stirred. This works well using a stirring hot plate found in most molecular genetics labs. One can also heat the gel solution in a microwave. As the mixture heats, the agarose goes into solution, forming a clear liquid. Now the gel is ready to be poured. Fig.3. Preparing the TBE electrophoresis buffer. Fig.4.Mixing the agarose powder and electrophoresis buffer on a stirring hotplate Pouring a gel Pouring an electrophoresis gel is the final step in preparing the molecular race track. The mold the gel is poured into is a plexiglass tray that is missing the two ends. Tape or removable ends are added prior to pouring to hold the hot liquid in place (Fig 5). Fig. 5. Preparing the gel mold by taping the ends. Pouring a gel Pouring an electrophoresis gel is the final step in preparing the molecular race track. The mold the gel is poured into is a plexiglass tray that is missing the two ends. A plexiglass comb is also added (Fig. 6). The teeth on this comb will stick into the cooling gel but not extend to the bottom of the mold. As the gel cools, each tooth in the comb forms a well. This is where the DNA sample will be placed. If many samples need to be compared in our electrophoresis race, combs with more teeth are used or more rows of combs are placed in the gel. When the gel cools, it solidifies to a semi-solid matrix that holds it’s shape. Fig. 6. Placing combs in the gel mold to establish the sample wells. Pouring a gel Pouring an electrophoresis gel is the final step in preparing the molecular race track. The mold the gel is poured into is a plexiglass tray that is missing the two ends. When the gel cools, it solidifies to a semi-solid matrix that holds it’s shape. The comb can be removed from the solid gel and the empty wells will serve as the starting line for the DNA samples (Fig. 7). Fig. 7. Taking the combs out of the solidified gel. Note the wells. Pouring a gel Pouring an electrophoresis gel is the final step in preparing the molecular race track. The mold the gel is poured into is a plexiglass tray that is missing the two ends. The tape is removed so current will flow through the gel once it is in the gel box (Fig. 8). Fig. 8. Removing the tape from the ends. Loading a gel established the starting line DNA samples will be run in the electrophoresis box and the gel can be placed in the box with electrophoresis buffer prior to loading the sample wells (Fig. 9). Fig. 9. Placing the gel into the gel box. Loading a gel established the starting line Fig. 10. A tracking dye is mixed with each DNA sample. DNA samples are brought to the starting line of the electrophoresis gel with the use of a pipette. The pipette can dispense a measured amount of DNA sample into each sample well. Since the DNA in solution lacks color, a dense tracking dye solution is often mixed in to visualize the gel loading process (Fig. 10). Loading a gel established the starting line It is easy to see that the gel loading step must be done with care to avoid mixing of samples (Fig. 11). Fig. 11. Using a pipette to load the DNA samples. Loading a gel established the starting line Fig. 12. The tracking dye aids in loading the samples. When the DNA solution plus tracking dye are loaded, the well will hold the colored mix in place until all the samples are loaded (Fig. 12). Now it is time for the race to determine which lane has DNA samples with longer fragments and which lane has DNA samples with shorter fragments. Conducting a fair race Fig. 14. Current is run through the gel by connecting it to a power supply. Electrophoresis uses electricity as the force to move the DNA molecules through the gel. The electrophoresis apparatus is designed to run a fair race by conducting the current evenly across the gel (Fig. 14). A wire is found along the bottom of the apparatus at both ends. Electrons supplied by the electrophoresis buffer will flow to the positive pole. The phosphates making up the DNA molecule's backbone create a negative charge so DNA will move toward the positive pole once the circuit is complete. As long as the current is flowing, DNA molecules will be subjected to the same force (the voltage) which carries them toward the positive end of the gel. This will cause the DNA fragments to move in a straight lane rather than wander toward the positive end. Therefore, each well in the electrophoresis gel establishes a lane for the DNA sample The agarose obstacle course Fig. 15. DNA fragments move through the gel by weaving in and out of the gel pours. The DNA race occurring in an electrophoresis gel is fair but it is an obstacle course. This is because the DNA molecules are forced to travel through the matrix of buffer filled spaces or pores that is created when the agarose gel is formed. The agarose gel provides a three dimensional lane. A random mix of small and large spaces will be found in any given part of the lane. If a DNA molecule cannot fit through a pore it moves up, or down to find a pore big enough to squeeze through. The molecule does not take a straight path to the positive end of the gel but instead wiggles through (Fig. 15). Shorter DNA segments find more pores that they can wiggle through, longer DNA segments need to do more squeezing and up or down moving. For this reason, shorter DNA segments move through their lane at a faster rate than longer DNA segments. That is why the gel electrophoresis method separates DNA molecules based on their size. The race in action Molecular geneticists are like racing fans. They need to observe the action to gain information about the DNA. The tracking dye provides some information. In addition to helping the geneticist load their DNA sample in the well, the tracking dye will also move in response to electric current and as it move it provides an indicator of how the DNA is moving. In Fig. 16, the tracking dye looks dark purple as it just begins to leave the wells. Fig. 16. The tracking dye moves along with the DNA sample. The race in action Fig. 17. The two dyes used to make the tracking dye separate as the dye moves through the gel. Molecular geneticists are like racing fans. They need to observe the action to gain information about the DNA. The tracking dye provides some information. In addition to helping the geneticist load their DNA sample in the well, the tracking dye will also move in response to electric current and as it move it provides an indicator of how the DNA is moving. In Fig. 17, the dye is now seen to consist of a mixture of a faster moving purple dye and a slower moving blue dye. By observing how the tracking dye moves, the geneticist can determine that current is moving through the gel. However, in room light, the DNA is not visible. The race in action Fig. 18. The ethidium bromide stained DNA can be observed running through the gel with a UV light source. Because DNA lacks color, another type of dye molecule that binds specifically to DNA is added to the electrophoresis buffer or to the gel. A commonly used dye is ethidium bromide. This dye has a structure that allows it to bind to the DNA helix and stay there. (note: Ethidium bromide’s DNA binding abilities make it a mutagen. Molecular geneticists wear gloves to prevent this dye from binding to the DNA in their own cells.) Ethidium bromide has an orange color in visible light but it’s real power for detection comes in the ultraviolet range of wavelengths. In UV light, the dye fluoresces brightly. Therefore to see the DNA, the gel is placed on a UV light source (Fig. 18) The race in action Ethidium bromide will emit a strong fluorescent signal, but detection of DNA depends on one additional factor; copies of the DNA segment. A single molecule of DNA cannot emit a strong enough fluorescent signal to be seen or detected. Instead, the molecular geneticist attempts to have hundreds or thousands of copies of the DNA segments they are trying to detect and load them in the gel well together. If the segments are the same length, they will move at about the same rate through the gel and form a band of DNA. The molecules making up this band collectively bind enough of the ethidium bromide to emit a detectable fluorescent signal. Therefore, when we view an electrophoresis gel that has been run and stained, we can observe bands of DNA. This is called the DNA fragment banding pattern. A band contains many copies of the same length molecule. Fig. 18. The ethidium bromide stained DNA can be observed running through the gel with a UV light source. A photo finish A gel run can last hours so a molecular geneticist only views the finish of the DNA fragment race. The gel is run for a set period of time and then the stained gel is photographed. The timing of this photo is important to properly compare the lanes of DNA segments. If the race is ended too early, the smaller segments may not have enough time to get ahead of the larger segments (Fig. 19). . Fig. 19. This gel has not run long enough to resolve two fragments If the race is ended too late, the smaller segments may have already reached the end of the gel and run off into the gel box. However, if the gel run is ended at the correct time, DNA samples with shorter fragments can be pictured forming bands that have moved farther through the gel than samples of longer fragments (Fig. 20). Fig. 20. Running the gel longer resolves the DNA sample into two bands. A photo finish When a DNA fragment banding pattern is different between samples, genetic differences are inferred to exist between the sources of each sample. The geneticist will describe this DNA fragment pattern as polymorphic (many forms). If the fragment banding is the same among samples they are monomorphic and no genetic differences are inferred from this analysis. So, whether a DNA race ends in a tie or whether fragments move at different speeds, gel electrophoresis reveals genetic information. Fragment patterns and molecular genotypes. One application of gel electrophoresis in DNA analysis is that it can reveal an individual’s genotype at a specific genetic locus. In this case, the DNA segments loaded into a sample well are copies of the DNA from one chromosomal region or locus from a single individual. In most applications, the DNA segment copies are made with the use of the PCR technique. In other applications (i.e. Southern blotting), these segments are detected among thousands of different length DNA segments that have been run through the gel. Molecular genotypes can be inferred from the fragment banding pattern observed if one keeps in mind what is happening at the molecular level. Fig. 21. The genotype of an individual at a specific locus can be inferred from a fragment banding pattern. We will describe the molecular basis of a genotype using a diploid organism as an example. In any tissue source from which we obtain DNA, this organism will have two copies of every chromosome and thus two copies of each gene on those chromosomes. If copies are made of the DNA at a specific locus, half of these copies in our sample will originate from the locus of one chromosome and the other half from the homologous chromosome. We can use electrophoresis to observe these DNA segments and determine if the organism was homozygous or heterozygous with respect to the DNA at that locus. Homozygous individuals will have the same DNA sequence at this locus in both chromosomes. Heterozygous individuals will have two different versions of this DNA. If the DNA sequence differences that occur result in a longer DNA segment from one chromosome (Fig. 21, lane 1) and a shorter segment from the other (Fig 21, lane 2), then we can visualize this difference in the electrophoresis banding pattern observed in the gel. If an individual is homozygous at the locus being analyzed, both chromosomes have the same DNA (Fig 21 lanes 1 and 2). If an individual is heterozygous at the locus, the DNA segment copies from one chromosome will be different than the DNA segment copies from the homologous chromosome (Fig. 21, lane 3). We will therefore see more DNA bands in our gel from a heterozygote. Fragment patterns and molecular genotypes. Fig. 21. The genotype of an individual at a specific locus can be inferred from a fragment banding pattern. The molecular genotypes just described are illustrated in the animation. Sample A or sample B would be from individuals that are homozygous and sample A & B would be from a heterozygous individual. In this case, one version of this locus has two smaller segments of DNA and the other version has one longer segment. Therefore, the heterozygous sample contains all three DNA segments. One segment is observed in one of the homozygous types and the other two DNA segments observed in the other homozygous type. The DNA sequence differences that result in the DNA segment lengths are described in another lesson. Alternative gels Fig. 21. The genotype of an individual at a specific locus can be inferred from a fragment banding pattern. The basics of DNA analysis described in this lesson can be applied to “modern” DNA genetic analysis that is becoming more common-place: DNA sequencing and high throughput DNA analysis. In DNA sequencing, the exact nucleotide order of a segment of DNA is determined. Here, an electrophoresis gel system is used that can separate fragments that differ in length by a single nucleotide. This is done by employing three technical alterations to the electrophoresis. First, acrylamide is used rather than agarose. This creates a more dense gel matrix that has a higher resolving power to separate DNA segments. Second, a longer gel is run. This is synonymous with a longer race that provides more spread between the fastest and the slowest fragments. Finally, the DNA segments are often labeled with a fluorescent dye and allowed to run past a detector and off the gel. The detector then sends this information to a computer. This allows the geneticist to worry less about timing a single photo finish of a gel and more information can be obtained from each gel. Therefore, the gel electrophoresis methods can be modified, depending on the analysis needs of the geneticist. When genetic analysis needs to be applied to many regions of the chromosomes on hundreds of individuals, the time and expense of pouring gels can become a limitation. Therefore, capillary electrophoresis systems have been developed. In this system a lane in a gel is substituted with a capillary tube which is the matrix. DNA forced into the capillary tube is labeled with some detectable molecule and moves through the tube in the same manner as has been described with gel electrophoresis. The advantage of the capillary system is that electrophoresis runs can be done in less time compared to gels. The tube may also be used again and again. The capillary system can also be integrated into an automated system that uses robotics to pipette arrays of samples into the tubes. Consequently, the capillary system has some advantages over traditional slab gel electrophoresis when a high through-put of samples is required. RNA and Protein electrophoresis The electrophoresis of RNA and proteins has a longer history than DNA electrophoresis. This is because these molecules are shorter in length than DNA in a cell and techniques did not need to be developed that either made a discrete segment of DNA (PCR) or detected that segment (Southern Blotting). RNA and proteins have other properties, however, that influence the electrophoresis methods used to separate them. One property is the formation of a secondary structure. Both molecules are single chains of subunits and these subunits can interact, forming loops, hairpins or sheets. If the molecule retains this secondary structure in the gel, it's mobility will not be directly related to it's length. This can be remedied by treating the molecules physically or chemically to eliminate secondary structure. RNA can be coated with formaldahyde or dimethyl formamide while protein can be treated with a detergent called sodium dodecyl sulfate (SDS). The treated molecules do not retain their secondary structure and thus move through an electrophoresis gel as linear chains. An additional issue with proteins is that the amino acid subunits will each have their chemical properties. Some amino acids have a negative charge, some a positive charge and some no charge at a given pH. The amino acid charges will determine the overall charge of a protein and thus how it moves in an electrophoresis gel. Treating proteins with SDS tends to create a uniform negative charge on the molecule. Proteins treated with SDS will thus have a negative charge, no secondary structure and an SDS gel will separate proteins based on their length. Thus the electrophoresis method has wide applications in molecular genetics but requires modifications based on the molecule of interest and the question being addressed. Fig. 21. The genotype of an individual at a specific locus can be inferred from a fragment banding pattern. Summary Electrophoresis is the method used by molecular geneticists to observe DNA, RNA and proteins and compare their relative lengths. This observation is indirect. A single segment of DNA and the dozens, hundreds or thousands of nucleotides that make it are too small to see. However, careful deployment of this technique and thoughtful interpretation of the fragment banding pattern can reveal the smallest differences in DNA sequences that account for the genetic variation among living things.
