Tables 1-6 Quality changes.doc
advertisement

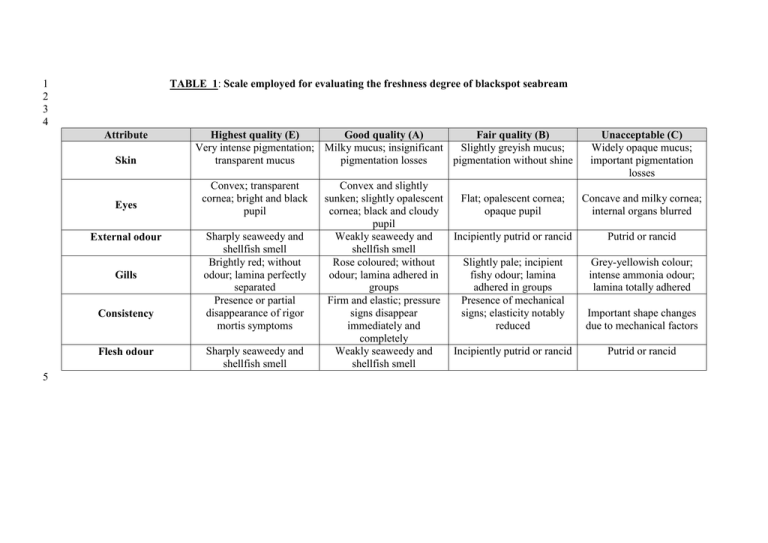
1 2 3 4 TABLE 1: Scale employed for evaluating the freshness degree of blackspot seabream Attribute Skin Eyes External odour Gills Consistency Flesh odour 5 Highest quality (E) Good quality (A) Fair quality (B) Very intense pigmentation; Milky mucus; insignificant Slightly greyish mucus; transparent mucus pigmentation losses pigmentation without shine Convex; transparent cornea; bright and black pupil Sharply seaweedy and shellfish smell Brightly red; without odour; lamina perfectly separated Presence or partial disappearance of rigor mortis symptoms Sharply seaweedy and shellfish smell Unacceptable (C) Widely opaque mucus; important pigmentation losses Convex and slightly sunken; slightly opalescent Flat; opalescent cornea; Concave and milky cornea; cornea; black and cloudy opaque pupil internal organs blurred pupil Weakly seaweedy and Incipiently putrid or rancid Putrid or rancid shellfish smell Rose coloured; without Slightly pale; incipient Grey-yellowish colour; odour; lamina adhered in fishy odour; lamina intense ammonia odour; groups adhered in groups lamina totally adhered Firm and elastic; pressure Presence of mechanical signs disappear signs; elasticity notably Important shape changes immediately and reduced due to mechanical factors completely Weakly seaweedy and Incipiently putrid or rancid Putrid or rancid shellfish smell 1 2 3 4 5 TABLE 2: Comparative sensory evaluation of fresh blackspot seabream subjected to slaughter and chilled storage in flow ice (FI) or ozonised flow ice (OFI), respectively* Attribute 6 7 8 9 10 11 12 13 3 6 Icing Time (days) 9 FI OFI A A Skin FI E OFI E FI A OFI A Eyes E E E E A External odour E E A E Gills E A A Consistency A A Flesh Odour E E 13 16 FI B OFI B FI B OFI B A A A B A A A B B B B A B A B B B B A A A A B B C B E E A A A A A A * Freshness categories as expressed in Table 1. Analyses carried out on day 1 provided E category for all attributes. 1 TABLE 3: Comparative growth of different microbial groups* in the muscle of blackspot seabream specimens 2 subjected to slaughter and chilled storage in flow ice (FI) and ozonised flow ice (OFI), respectively** 3 4 5 Icing time (days) 1 3 6 9 13 16 6 7 8 9 10 11 12 Aerobic mesophiles Psychrotrophes Lipolytic bacteria Proteolytic bacteria FI OFI FI OFI FI OFI FI OFI 2.75 b (0.27) 1.88 (0.43) 1.60 (0.86) 1.92 b (0.33) 4.04 b (0.19) 3.19 b (0.18) 2.10 a (0.14) 1.43 (0.42) 1.73 (0.61) 1.00 a (0.05) 3.53 a (0.23) 2.22 a (0.52) 2.72 b (0.21) 2.72 b (1.21) 1.10 (0.14) 3.21 b (0.21) 3.27 (0.23) 3.29 (0.25) 2.10 a (0.04) 1.00 a (0.05) 1.90 (1.27) 2.69 a (0.14) 3.10 (0.22) 2.79 (0.23) 2.00 (0.05) 2.00 (0.05) 2.00 (0.04) 2.42 (0.32) 2.89 (0.69) 3.49 (0.78) 2.38 (0.35) 2.38 (0.35) 2.00 (0.05) 2.20 (0.28) 2.55 (0.79) 2.60 (0.86) 2.95 (0.95) 2.00 (1.00) 2.33 (0.50) 2.35 (0.35) 3.77 (0.12) 3.73 b (0.83) 2.68 (0.88) 2.10 (0.18) 2.10 (0.18) 2.00 (0.10) 3.28 (0.90) 2.20 a (0.14) Histamineproducing bacteria FI OFI 2.30 (0.40) 2.00 (0.10) 2.00 (0.10) 2.10 (0.14) 2.96 (1.05) 2.66 (0.75) 2.10 (0.14) 2.00 (0.10) 2.00 (0.10) 2.00 (0.10) 2.33 (0.45) 2.00 (0.10) * Average values of three (n = 3) independent determinations, expressed as log CFU g-1 muscle. Standard deviations are indicated in brackets. ** For each microbial group, mean values followed by a different letter (a, b) denote significant differences (p<0.05) between both icing batches. 1 2 3 4 5 TABLE 4: Identification of histamine-producing bacteria isolated from the muscle of blackspot seabream Strain number 1 2 3 4 5 6 8 10 11 14 21 22 23 6 7 8 9 10 11 12 13 14 15 Gram + + - Catalase Oxydase + + + + + + + + + + + + + + + + + + + + + + + + Bacterial species Stenotrophomonas maltophilia Pseudomonas sp Pseudomonas fragi Pseudomonas putida Stenotrophomonas sp Stenotrophomonas maltophilia Stenotrophomonas maltophilia Bacillus cereus Pseudomonas putida Shewanella baltica Bacillus cereus Pseudomonas syringae Pseudomonas sp 1 TABLE 5: Comparative assessment* of trimethylamine oxide (TMAO), total volatile bases (TVB) and trimethylamine 2 (TMA) in the muscle of blackspot seabream specimens subjected to slaughter and chilled storage in flow ice (FI) and 3 ozonised flow ice (OFI), respectively** 4 5 6 Icing Time (days) 1 3 6 9 13 16 Trimethylamine oxide-nitrogen (mg TMAO-N kg-1 muscle) FI OFI 187.1 204.0 (18.5) (40.0) 197.6 210.7 (0.5) (18.6) 180.0 221.8 (22.1) (48.7) 186.6 215.0 (1.9) (33.2) 192.6 208.1 (11.8) (11.1) 164.0 a 193.9 b (2.3) (4.9) Total volatile base-nitrogen (mg TVB-N kg-1 muscle) FI OFI 280.9 297.6 (6.6) (15.1) 310.6 314.9 (12.4) (15.4) 310.6 313.4 (17.5) (17.2) 305.7 313.8 (8.9) (16.3) 264.1 284.1 (16.5) (10.8) 271.2 284.7 (14.7) (14.7) Trimethylamine-nitrogen (mg TMA-N kg-1 muscle) FI OFI 0.3 0.3 (0.1) (0.0) 0.7 b 0.5 a (0.1) (0.0) 0.6 0.6 (0.0) (0.1) 1.4 b 0.7 a (0.4) (0.0) 1.5 1.5 (0.0) (0.1) 2.5 2.4 (0.2) (0.5) 7 8 9 10 * Average values of three (n = 3) independent determinations. Standard deviations are indicated in brackets. 11 ** For each quality index, mean values followed by a different letter (a, b) denote significant differences (p<0.05) between both icing 12 conditions. 1 TABLE 6: Comparative lipid oxidation evolution* in the muscle of blackspot seabream specimens subjected to slaughter 2 and chilled storage in flow ice (FI) and ozonised flow ice (OFI), respectively** 3 4 5 Icing Time (days) 1 3 6 9 13 16 Peroxide value (meq oxygen kg-1 lipids) FI OFI 2.45 2.54 (0.86) (0.75) 1.75 a 5.93 b (0.06) (1.69) 2.75 a 3.72 b (0.14) (0.37) 2.58 2.20 (1.35) (0.65) 3.94 4.47 (0.44) (0.99) 6.66 a 8.34 b (0.16) (1.10) Thiobarbituric acid index (mg malondialdehyde kg-1 muscle) FI OFI 0.07 a 0.10 b (0.01) (0.01) 0.09 0.08 (0.01) (0.04) 0.07 a 0.12 b (0.01) (0.02) 0.07 0.06 (0.02) (0.03) 0.05 a 0.08 b (0.01) (0.01) 0.21 0.19 (0.09) (0.08) Fluorescence formation FI 2.07 (0.10) 2.13 (0.17) 1.58 (0.70) 2.07 (0.08) 3.18 (0.39) 3.34 (0.13) OFI 2.18 (0.21) 2.17 (0.06) 1.92 (0.21) 2.36 (0.51) 3.45 (0.18) 3.54 (0.21) 6 7 8 9 10 11 * Average values of three (n = 3) independent determinations. Standard deviations are indicated in brackets. 12 ** For each quality index, mean values followed by a different letter (a, b) denote significant differences (p<0.05) between both icing 13 conditions.


