HW1 - Quartiles and Percentiles
advertisement
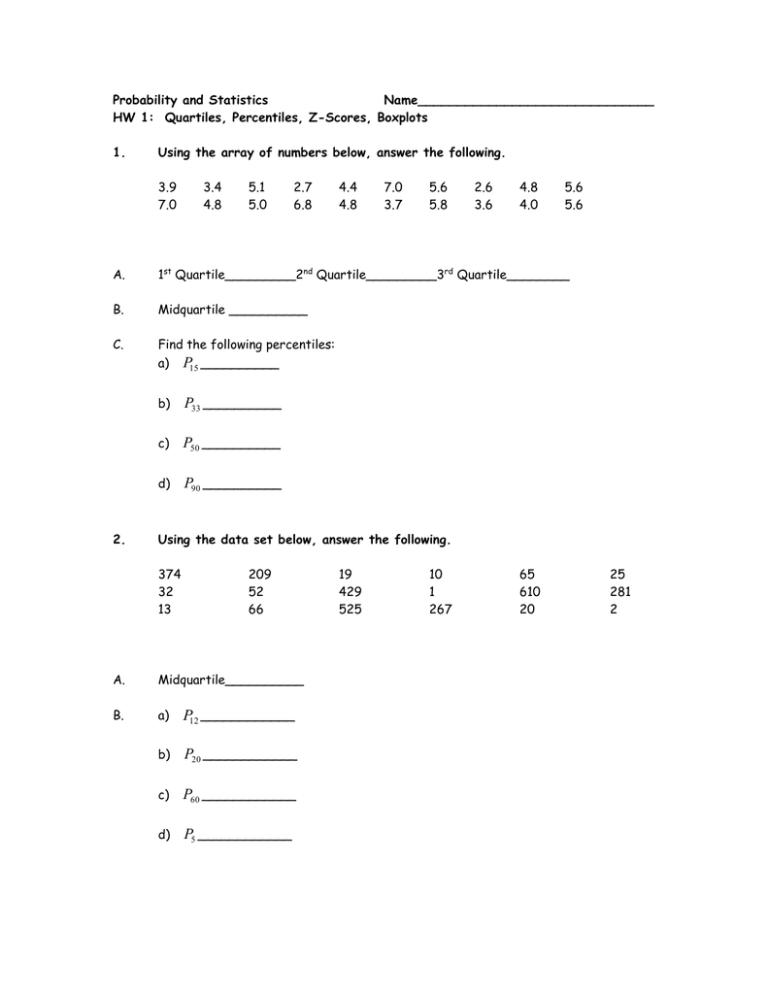
Probability and Statistics Name______________________________ HW 1: Quartiles, Percentiles, Z-Scores, Boxplots 1. Using the array of numbers below, answer the following. 3.9 7.0 3.4 4.8 5.1 5.0 2.7 6.8 4.4 4.8 7.0 3.7 5.6 5.8 2.6 3.6 4.8 4.0 5.6 5.6 A. 1st Quartile_________2nd Quartile_________3rd Quartile________ B. Midquartile __________ C. Find the following percentiles: a) P15 __________ 2. b) P33 __________ c) P50 __________ d) P90 __________ Using the data set below, answer the following. 374 32 13 209 52 66 A. Midquartile__________ B. a) P12 ____________ b) P20 ____________ c) P60 ____________ d) P5 ____________ 19 429 525 10 1 267 65 610 20 25 281 2 Z-Scores: 3. A sample has a mean of 50 and a standard deviation of 4. Find the z-score for each value of x. a. x 54 b. x 50 c. x 59 4. An exam produced grades with a mean score of 74.2 and a standard deviation of 11.5. Find the z-score for each test score. a. x 54 b. x 79 c. x 93 5. A nationally administered test has a mean of 500 and a standard deviation of 100. If your standard score on this test was 1.8, what was your test score? 6. A sample has a mean of 120 and a standard deviation of 20. Find the value of x that corresponds to each of these standard scores. a. z 0 b. z 1.2 c. z 1.4 7. a. What does it mean to say that x 152 has a standard score of 1.5 ? b. What does it mean to say that a particular value of c. 8. x has a z-score of -2.1? In general, the z-score is a measure of ______________________________. Which x value has the higher position relative to the set of data from which it comes? A: x 85, x 72, s 8 B: x 93, x 87, s 8 Directions: Day 1: Draw the box plots and comment on skewness. Day 2: Find any outliers for each data set. 1. 2. 3. 4. 5. 21, 23, 27, 32, 38, 42, 80 Day 1: Day 2: 2, 18, 21, 20, 19, 22, 23, 35 Day 1 : Day 2: 6, 8, 12, 15, 18, 22, 22, 25, 27, 27, 28, 29 Day 1 : Day 2: 6, 8, 22, 27, 29, 35, 42, 53, 70 Day 1 : Day 2: 16, 95, 87, 120, 122, 137, 138, 140, 195 Day 1: Day 2:
