Please draw the titration curves for the following titrations.docx
advertisement

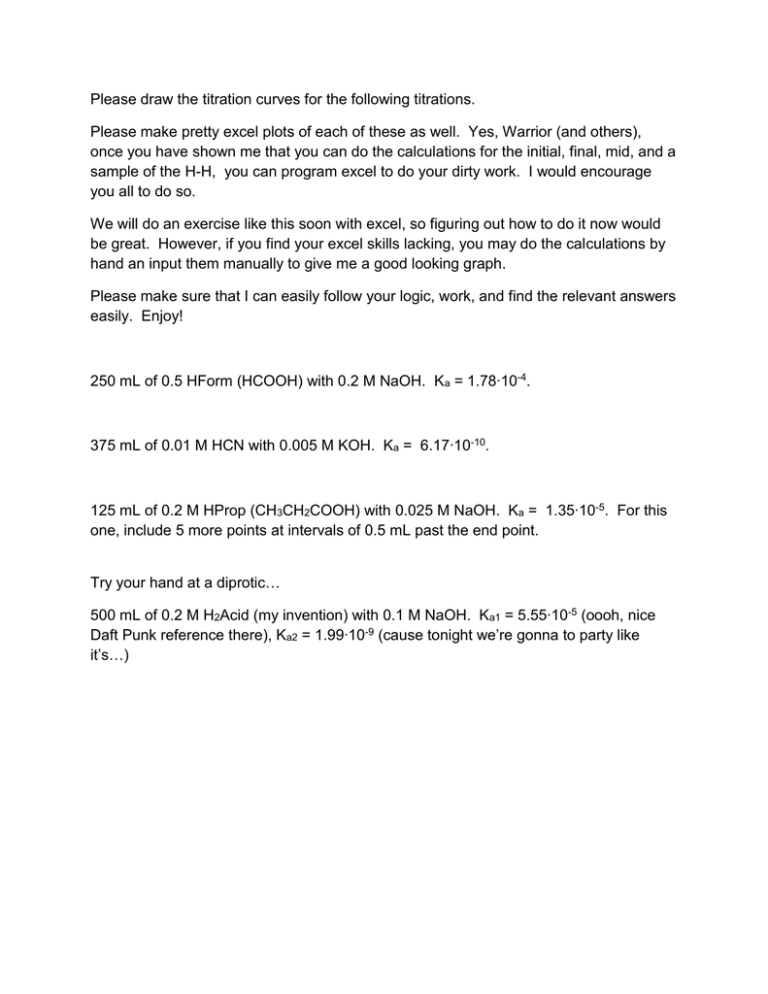
Please draw the titration curves for the following titrations. Please make pretty excel plots of each of these as well. Yes, Warrior (and others), once you have shown me that you can do the calculations for the initial, final, mid, and a sample of the H-H, you can program excel to do your dirty work. I would encourage you all to do so. We will do an exercise like this soon with excel, so figuring out how to do it now would be great. However, if you find your excel skills lacking, you may do the calculations by hand an input them manually to give me a good looking graph. Please make sure that I can easily follow your logic, work, and find the relevant answers easily. Enjoy! 250 mL of 0.5 HForm (HCOOH) with 0.2 M NaOH. Ka = 1.78∙10-4. 375 mL of 0.01 M HCN with 0.005 M KOH. Ka = 6.17∙10-10. 125 mL of 0.2 M HProp (CH3CH2COOH) with 0.025 M NaOH. Ka = 1.35∙10-5. For this one, include 5 more points at intervals of 0.5 mL past the end point. Try your hand at a diprotic… 500 mL of 0.2 M H2Acid (my invention) with 0.1 M NaOH. Ka1 = 5.55∙10-5 (oooh, nice Daft Punk reference there), Ka2 = 1.99∙10-9 (cause tonight we’re gonna to party like it’s…)


