Research Methods folks:
advertisement

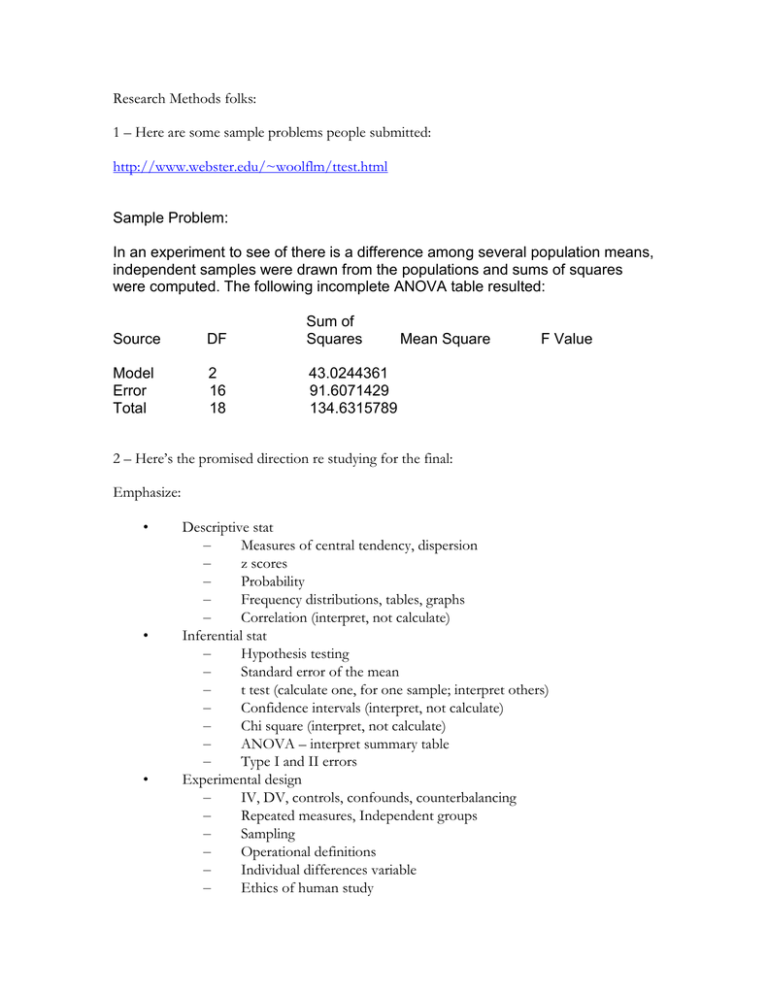
Research Methods folks: 1 – Here are some sample problems people submitted: http://www.webster.edu/~woolflm/ttest.html Sample Problem: In an experiment to see of there is a difference among several population means, independent samples were drawn from the populations and sums of squares were computed. The following incomplete ANOVA table resulted: Source DF Sum of Squares Model Error Total 2 16 18 43.0244361 91.6071429 134.6315789 Mean Square F Value 2 – Here’s the promised direction re studying for the final: Emphasize: • • • Descriptive stat – Measures of central tendency, dispersion – z scores – Probability – Frequency distributions, tables, graphs – Correlation (interpret, not calculate) Inferential stat – Hypothesis testing – Standard error of the mean – t test (calculate one, for one sample; interpret others) – Confidence intervals (interpret, not calculate) – Chi square (interpret, not calculate) – ANOVA – interpret summary table – Type I and II errors Experimental design – IV, DV, controls, confounds, counterbalancing – Repeated measures, Independent groups – Sampling – Operational definitions – Individual differences variable – Ethics of human study – Possible sources of bias and error variance and how to minimize/eliminate Qualitative methods – Per Rice Lively, Gracy – Survey generation (from SZZ, Ch. 5) • De-emphasize • • • • • • Complicated probability calculations APA ethical standard (S,Z, & Z, Ch. 3) Content analysis (SZZ, Ch. 6) Calculating an ANOVA. Nonequivalent control group design (SZZ, Ch. 11) (Indeed, de-emphasize all Ch. 11.) Hinton, Ch. 12 Bring your questions Wednesday. Randolph.


