Chapter 12 3d
advertisement
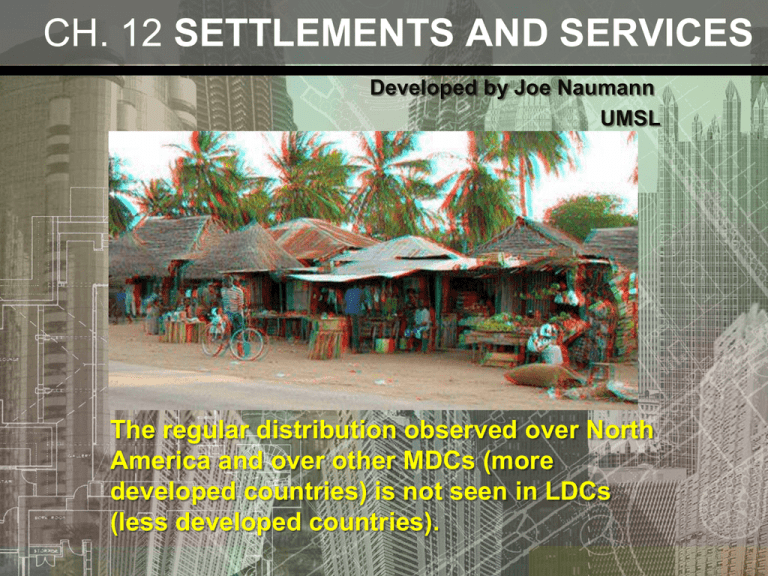
CH. 12 SETTLEMENTS AND SERVICES Developed by Joe Naumann UMSL The regular distribution observed over North America and over other MDCs (more developed countries) is not seen in LDCs (less developed countries). Regular Distribution 2 Distribution of Cities 3 Distribution of Cities • The world has 22 cities with at least 10 million inhabitants. • Surprisingly, seven of the 10 largest cities are in LDCs. 4 5 Look at the air pollution 6 7 8 9 10 11 12 13 Details: According to Demographia • 177 urban areas have at least 2 million inhabitants • 100 at least 3 million • 55 at least 5 million, • 22 at least 10 million • 3 (Tokyo, New York, and Seoul) at least 20 million 14 Cities in History 15 Ancient World Cities Oldest cities are found in Mesopotamia, Egypt, China and Indus Valley. Mesopotamia (Jordan/Iraq) Jericho 10,000 B.C. Ur 3,000 B.C. (Iraq) Walled cities based on agricultural trade Ziggurat (stepped temple) 16 Ancient Ur in Mesopotamia 17 Ancient Athens 18 Cities in History 19 Largest OLD World Cities From fall of Rome until the Industrial Revolution 5 Most Populous by C.E. 900 Baghdad (Iraq) Constantinople (Istanbul, Turkey) Kyoto (Japan) Changan (China) Hangchow (China) Before Industrial Revolution Canton (China) Beijing (China) Agra (India) Cairo (Egypt) Canton (China) Isfahan (Iran) Osaka (Japan) 20 Historic City Functions Commercial Centers - Fresno, Venice, New York Industrial Cities - Manchester, Detroit, Los Angeles Primary Resources - Scotia, Minas Gerais, Nevada City Resort Cities - Santa Barbara, Las Vegas, Marseille Government / Religious Centers - Monterey, D.C., Brasilia Education Centers - Palo Alto, Berkeley 21 Urbanization Percent urban by world region 22 Urbanization 23 Urbanization • A large percentage of people living in urban areas is a measure of a country’s level of development • higher percentage of urban residents in MDCs is a consequence of changes in economic structure – Rural residents migrated to cities – 19th century Industrial Revolution – 20th century growth of services 24 Urban 25 Urban/Industrial 26 Economic base of cities • basic industries, which export primarily to consumers • Nonbasic industries are enterprises whose customers live in the same community, essentially consumer services • A community’s unique collection of basic industries defines its economic base. • Multiplier Effect – for each new job in basic industries, approximately two new jobs are created in the nonbasic industries • Examples in St. Louis metro. area – Basic Industries – GM plant, Boeing, etc. – Nonbasic industries – Dierberg’s Markets, Handyman Hardware, etc. 27 Types of Services • Service Sector – Consumer, business, & public • Consumer Services 28 Consumer Services Nearly one-half of all jobs in the United States are in consumer services 29 Services • % of GDP from the Service Sector • Usually higher in MDCs 30 Employment • The growth in employment in the United States has been in services, • Employment in primary-sector activities declined • Employment in secondary-sector activities has declined 31 32 Public Sector Activities • Public services provide security and protection for citizens and businesses – 9% public school teachers are not counted in this category – 1/6 (16.7%) work for Federal Government – ¼ (25%) work for state governments – 3/5 (60%) work for local governments 16% 33 Hierarchy of Business Services • A hierarchy of world cities can be identifi ed based on business services • A hierarchy of cities also exists inside the United States • World Cities – London, New York, Paris, and Tokyo are the four leading world cities – Chicago, Frankfurt, Hong Kong, Los Angeles, Milan, and Singapore are world cities of somewhat lower importance than the Big Four 34 World Cities 35 Lloyds of London Multifaceted Centers • World cities are predominantly in MDCs because they are home to a large percentage of the world’s global-scale business services, including : – Financial services such as banking and insurance – Information-gathering services such as publishing and media – Professional services such as law, medicine, science, and education – contain a disproportionately high share of the world’s arts, culture, consumer spending on luxury goods, and political power 36 Hierarchy of U.S. Cities 37 2nd Tier: Command & Control Centers Orlando, Florida • Headquarters of many large corporations, well-developed banking facilities, and concentrations of other business services • 3rd Tier Centers - Offer narrower and more highly specialized services – Motor vehicles, steel, office equipment, etc. • 4th Tier centers generally provide less skilled jobs – – – – Resort, retirement, residential centers Manufacturing centers Industrial & military centers Mining and industrial centers 38 Coolness & Innovation • Talent is not distributed uniformly among cities. • Talent is attracted to cities that are diverse and “cool” • Talent level based on percentages of: – College graduates – Scientists & engineers – Employment in technical & professional jobs • “Coolness” is related to cultural diversity • Florida discovered that talented individuals were not attracted by climate or proximity to sports 39 Measures of Diversity • Cultural facilities per capita • % of gay men • “coolness index” – Percent of population in 20s – Number of bars & nightlife facilities per capita – Number of art galleries per capita 40 Talent Cultural Diversity 41 Central Place Theory • Central place theory explains the location of consumer services (a model) • Central place has a market area, range, and threshold. Market Area Node Range – distance from the node Threshold – the periphery of the market area (a transition zone between market areas) Market Area – or hinterland – a nodal region Distance Decay – the farther from the node, the weaker the connection 42 Why Hexagons? • No gaps or overlaps & approximates the ideal shape – a circle! • Reality more or less approximates the model. • Factors affecting the range and shape of a hinterland – Irregularities in topography – Natural divisions – rivers, canyons, etc. – Political boundaries – Cultural and/or linguistic transition zones 43 Services • Larger centers offer more services and more specialized services than smaller centers – – – – – – Health care Wholesale distribution Retail – consumer goods Hospitality Entertainment Education 44 Nesting of Settlements & Services • Large settlements offer services with large thresholds, ranges & market areas. • Small settlements provide services with small thresholds, ranges, and market areas. • The size of settlements follows the rank-size rule more closely in MDCs than in LDCs. 45 Central Place Theory and Reality Transportation Effect • Transportation and border effects can shift the distribution of towns away from theoretical uniformity Border Effect 46 Some less than precise terms • Metropolis - a large and densely populated urban area; may include several independent administrative districts; a large city, especially the chief city of a country • World City (Global City) - A fairly large population (the centre of a metropolitan area with a population of at least one million, typically several million) having active influence and participation in international events and world affairs (political & economic) 47 Some less than precise terms • City - primarily used to designate an urban settlement with a large population. However, city may also indicate a special administrative, legal, or historical status. • Town - a community of people ranging from a few hundred to several thousands, although it may be applied loosely even to huge metropolitan areas. Usually, a "town" is thought of as larger than a village but smaller than a "city“ • Village - a clustered human settlement or community, larger than a hamlet, but smaller than a town or city, generally located in rural areas, 48 Town 49 Village 50 Town: Orange Walk, Belize 51 Town: Herman, MO, U.S.A. 52 Town: Warri, Nigereia 53 African Village 54 German Village 55 U.S. village – Elsah, IL 56 Some less than precise terms • Hamlet - a small rural settlement, too small to be considered a village. • Metropolitan area - a large population centre consisting of a large metropolis and its adjacent zone of influence, or of more than one closely adjoining neighboring central cities and their zone of influence. One or more large cities may serve as its hub or hubs. In practice the parameters, in both official and unofficial usage, are not consistent. Sometimes they are little different from an urban area, and in other cases they cover broad regions larger than a single urban settlement. 57 Hamlet 58 Hamlet 59 Hamlet 60 Swiss Hamlet 61 A Cluster of Rural Farm Hamlets Eastern Hemisphere model: live in the hamlet and go out to the fields to work 62 Alternate Rural Farm Settlement U.S.A., Canada, Australia 63 Megalopolis • Illustrates the difference between strict city proper definitions and broader urban agglomerations. • To define urbanized areas, the U.S. Census Bureau uses the term Metropolitan Statistical Area (MSA) or Consolidated MSA (CMSA) if two of them overlap. 64 Transportation & Settlement Size 65 U.S. Urban Growth Stages 66 Rank-Size Settlement Distribution • Primate city – largest in a country & two or more times the size of the second largest city • Rank-Size Rule: in which the country’s nthlargest settlement is 1/n the population of the largest settlement. • A country that follows the rank-size rule will graph as a straight line (U.S. comes very close) 67 Primate City Rule • Largest settlement in a country has more than twice the number as the second ranking city. These cities tend to represent the perceived culture of the country. Largest City Paris London Population 9 million 9 million Second-largest City Population Marseille Birmingham 2 million 2 million 68 Rank-Size Rule • The n th-largest settlement is 1/n the population of the largest settlement. In other words, 2nd largest is 1/2 the size of largest. Works best in most developed countries that have full distribution of services 69 Market Area Analysis Elder-Beerman Department Stores • Retailers determine profitability of a site by calculating the range and threshold. • Site selection is done by placing consumer behavior data on GIS (Geographic Information System computer software) • The best location will be the one that minimizes the distances that all potential customers must travel to reach the service. • The gravity model predicts that the optimal location of a service is directly related to the number of people in the area and inversely related to the distance people must travel to access it. 70 Locating a new retail unit • Assess the market area for a proposed new unit • Hierarchy of store ranges – The market area of Nordstroms is larger than the market area of Macy department store – Market area of Schnucks at Grandview is larger than the market area of Duchesne Tomboy grocery store UDF convenience stores 71 Characteristics of European Cities Complex street patterns - prior to automobile, weird angles Plazas and Squares - from Greek, Roman, Medieval High density and compact form - wall around city or low-growth zoning Low skylines - many built before elevators, others required cathedral or monument to be highest structure Lively downtowns - center of social life, not just office work Neighborhood stability - Europeans moved less frequently than we do. 72 Characteristics Continued Scars of War - many wars , many cities originally defensive Symbolism - gothic cathedrals, palaces, and castles Municipal Socialism - many residents live in buildings that are owned by city gov’t. Some of these are massive housing projects, others small scale apartment buildings. 73 U.S. vs. European Cities European cities, including this hypothetical U.K. example, tend to restrict suburban development, thereby concentrating new development in and around existing concentrations. This leaves large rings of open space, so-called greenbelts What are the social costs of sprawl? 74 Changes in U.S. Cities U.S. population has been moving out of the city centers to the suburbs: suburbanization and counterurbanization U.S. intraregional migration during 1990s. 75 MDC Cities • • Developed Countries: suburbanization wealthy move to suburbs automobiles and roads; ‘American Dream’ better services wealthy move to suburbs counterurbanization idyllic settings cost of land for retirement slow pace, yet high tech connections to services and markets 76 Changes in Cities in LDCs Rio De Janeiro, Brazil Populations of cities in the less developed world have been surging: urbanization, migration, natural increase 77 Urbanization in LDCs: driven by changes in economy the poor live in the suburbs, rich live in CBD cities struggle to provide jobs and housing services overtaxed squatter settlements common crime on the rise 78
