Sample 4: Cochlear Implant Survey and Data Report
advertisement
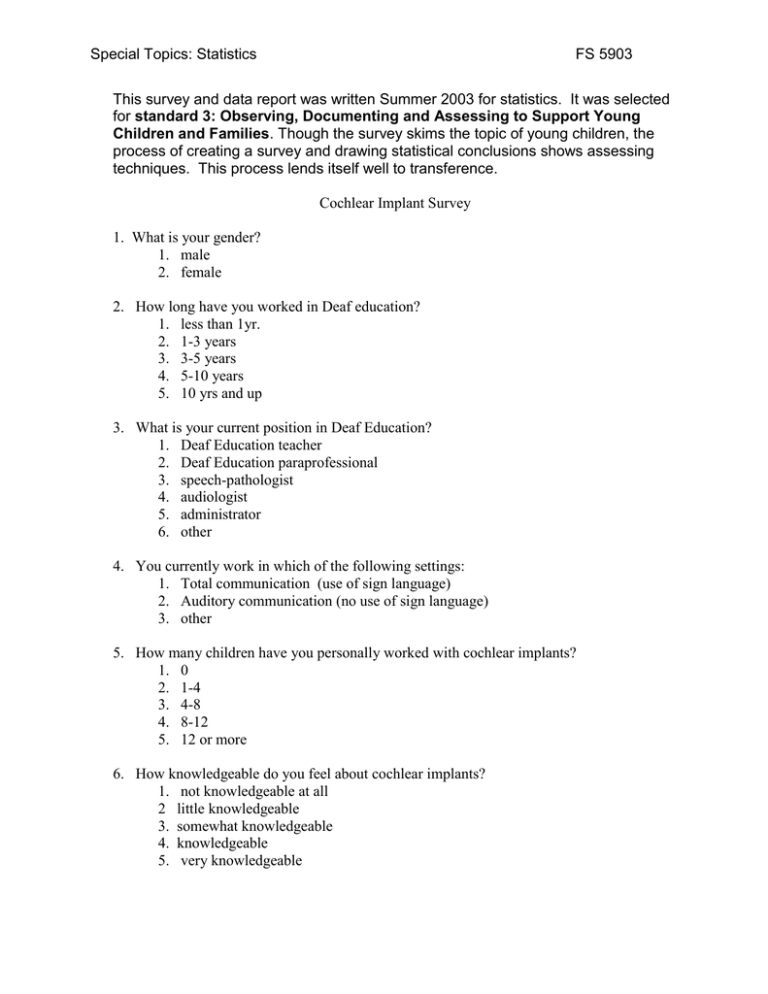
Special Topics: Statistics FS 5903 This survey and data report was written Summer 2003 for statistics. It was selected for standard 3: Observing, Documenting and Assessing to Support Young Children and Families. Though the survey skims the topic of young children, the process of creating a survey and drawing statistical conclusions shows assessing techniques. This process lends itself well to transference. Cochlear Implant Survey 1. What is your gender? 1. male 2. female 2. How long have you worked in Deaf education? 1. less than 1yr. 2. 1-3 years 3. 3-5 years 4. 5-10 years 5. 10 yrs and up 3. What is your current position in Deaf Education? 1. Deaf Education teacher 2. Deaf Education paraprofessional 3. speech-pathologist 4. audiologist 5. administrator 6. other 4. You currently work in which of the following settings: 1. Total communication (use of sign language) 2. Auditory communication (no use of sign language) 3. other 5. How many children have you personally worked with cochlear implants? 1. 0 2. 1-4 3. 4-8 4. 8-12 5. 12 or more 6. How knowledgeable do you feel about cochlear implants? 1. not knowledgeable at all 2 little knowledgeable 3. somewhat knowledgeable 4. knowledgeable 5. very knowledgeable Special Topics: Statistics FS 5903 7. How comfortable to feel working with a child with a cochlear implant? 1. not comfortable at all 2. little comfortable 3. somewhat comfortable 4. comfortable 5. very comfortable 8. How confident to you feel you could troubleshoot (figure out) what was wrong with a child’s processor? 1. not knowledgeable at all 2. little knowledgeable 3. somewhat knowledgeable 4. knowledgeable 5. very knowledgeable 9. What is your overall attitude towards cochlear implants? 1. very negative 2 negative 2. neutral 4. positive 5. very positive 10. Would you be willing to attend staff developments concerning cochlear implants? 1. yes 2. no Data report below Special Topics: Statistics FS 5903 Cochlear Implant Survey Report Demographics of Population: 86.7 % of the Deaf Education Staff is female. (N=26) 13.3% of the Deaf Education staff is male. (N=4) GENDER MALE (13.3%) FEMALE (86.7%) Duration Less than 1 year: 13.3%; 1-3 years: 66.7% 3-5 years: 10% 5-10 years: 10 % median: 1-3 years mode: 1-3 years LENGTH OF WORK 5-10 YEARS-10% 3-5 YEARS-10% LESS THAN 1 YR-13.3% 1-3 YEARS-66.7% positions: 3. Deaf Education teacher-11 4. Deaf Education paraprofessional—0 5. speech-pathologist-12 6. audiologist-3 7. administrator-4 8. other-0 median: Speech pathologist mode: Speech pathologist Special Topics: Statistics FS 5903 POSITION 14 12 Number 10 8 6 4 Std. Dev = 1.43 2 Mean = 2.6 N = 30.00 0 1.0 2.0 3.0 4.0 5.0 POSITION Mode of Communication: Total communication: 18 Auditory communication 4 Other: 8 Median: Total Mode: Total MODE OF COMMUNICATION OTHER (26.7%) TOTAL COMM (60%) AUDITORY COM(13.3%) Number of Kids: 0—0 1-4—12 4-8—14 8-12—4 12 & up--0 Median: 4-8 kids Mode: 4-8 kids *Every professional has had exposure to an implanted child. NUMBER OF IMPLANTED KIDS 16 14 12 10 8 Frequency 6 4 Std. Dev = .69 2 Mean = 2.73 N = 30.00 0 2.00 2.50 3.00 3.50 NUMBER OF IMPLANTED KIDS 4.00 Special Topics: Statistics FS 5903 Knowledgeable: 1. not knowledgeable at all—0 2 little knowledgeable—4 3. somewhat knowledgeable—14 4. knowledgeable—8 5. very knowledgeable—4 Mean: 3.4 KNOWLEDGE OF CI 16 14 12 10 8 6 Frequency 4 Std. Dev = .89 2 Mean = 3.4 N = 30.00 0 2.0 3.0 4.0 5.0 KNOWLEDGE OF CI Comfort 1.not comfortable at all—0 2 little comfortable—0 3.somewhat comfortable--11 4. comfortable--11 5.very comfortable--8 mean—3.9 COMFORT WORKING WITH CI 12 10 8 6 Frequency 4 2 Std. Dev = .80 Mean = 3.90 N = 30.00 0 3.00 3.50 4.00 4.50 5.00 COMFORT WORKING WITH CI Confident to Troubleshoot 1.not confident at all—0 2. little confident--11 3.somewhat confident--15 4. confident--0 5. very confident--4 Mean 2.90 Special Topics: Statistics FS 5903 CONFIDENT TROUBLESHOOT 16 14 12 10 8 Frequency 6 4 Std. Dev = .96 2 Mean = 2.9 N = 30.00 0 2.0 3.0 4.0 5.0 CONFIDENT TROUBLESHOOT Overall attitude: 1.very negative—0 2 negative--0 3.neutral --0 4. positive--22 5. very positive--8 mean:4.27 There is a moderate correlation (r=.447) between number of kids and comfort of working with children with cochlear implant. There is a moderate correlation (r=.527) between position in the department and confidence to troubleshoot cochlear implant problems. There is little statistical significant difference (.155) between modes of communication when it comes to overall attitude F(2,27)=.155, p<.05 100% of Deaf Ed staff is willing to attend staff development on cochlear implants.
