Tagging Lab
advertisement

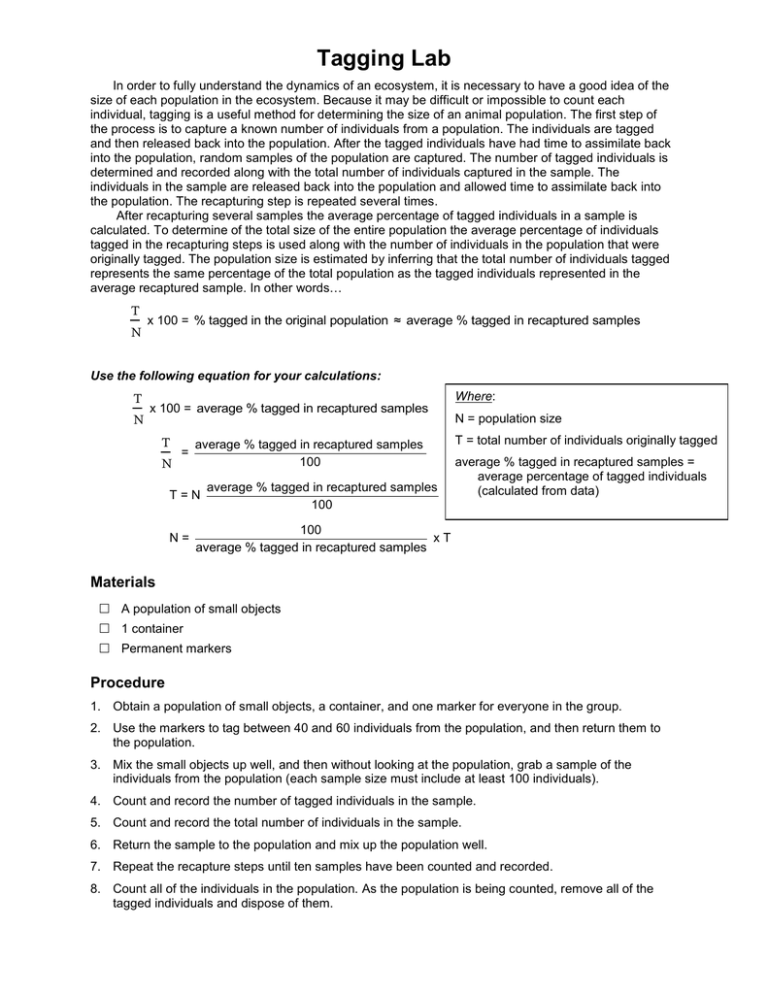
Tagging Lab In order to fully understand the dynamics of an ecosystem, it is necessary to have a good idea of the size of each population in the ecosystem. Because it may be difficult or impossible to count each individual, tagging is a useful method for determining the size of an animal population. The first step of the process is to capture a known number of individuals from a population. The individuals are tagged and then released back into the population. After the tagged individuals have had time to assimilate back into the population, random samples of the population are captured. The number of tagged individuals is determined and recorded along with the total number of individuals captured in the sample. The individuals in the sample are released back into the population and allowed time to assimilate back into the population. The recapturing step is repeated several times. After recapturing several samples the average percentage of tagged individuals in a sample is calculated. To determine of the total size of the entire population the average percentage of individuals tagged in the recapturing steps is used along with the number of individuals in the population that were originally tagged. The population size is estimated by inferring that the total number of individuals tagged represents the same percentage of the total population as the tagged individuals represented in the average recaptured sample. In other words… T N x 100 = % tagged in the original population ≈ average % tagged in recaptured samples Use the following equation for your calculations: T N Where: x 100 = average % tagged in recaptured samples T N = average % tagged in recaptured samples 100 T=N N= average % tagged in recaptured samples 100 N = population size T = total number of individuals originally tagged average % tagged in recaptured samples = average percentage of tagged individuals (calculated from data) 100 xT average % tagged in recaptured samples Materials A population of small objects 1 container Permanent markers Procedure 1. Obtain a population of small objects, a container, and one marker for everyone in the group. 2. Use the markers to tag between 40 and 60 individuals from the population, and then return them to the population. 3. Mix the small objects up well, and then without looking at the population, grab a sample of the individuals from the population (each sample size must include at least 100 individuals). 4. Count and record the number of tagged individuals in the sample. 5. Count and record the total number of individuals in the sample. 6. Return the sample to the population and mix up the population well. 7. Repeat the recapture steps until ten samples have been counted and recorded. 8. Count all of the individuals in the population. As the population is being counted, remove all of the tagged individuals and dispose of them. Data Analysis 1. Calculate the percentage of tagged individuals in each sample. 2. Calculate the average percentage of tagged individuals. 3. Calculate the estimated population size. 4. Calculate the percent error for your estimate: % error = | actual#estimated# | x 100 actual# Discussion Write a two or three paragraph discussion which includes the following. o Analysis and comments on the accuracy of the results. o Identification and discussion the sources of error in the lab. o Description and discussion of the inherent challenges associated with the capture and release method of estimating population size. o Discussion of the challenges that a field biologist would encounter in the course of using this method to estimate the population size of an animal being studied. Tagging Lab Grade Sheet Name /100 Table of Contents updated /300 Calculations shown /100 Materials & Procedure listed /500 Data Table clear and organized /100 Data signed & dated /300 Percent Error calculated /100 No Obliterated Data /500 Discussion /2000 Total Tagging Lab Grade Sheet Name /100 Table of Contents updated /300 Calculations shown /100 Materials & Procedure listed /500 Data Table clear and organized /100 Data signed & dated /300 Percent Error calculated /100 No Obliterated Data /500 Discussion /2000 Total Tagging Lab Grade Sheet Name /100 Table of Contents updated /300 Calculations shown /100 Materials & Procedure listed /500 Data Table clear and organized /100 Data signed & dated /300 Percent Error calculated /100 No Obliterated Data /500 Discussion /2000 Total Tagging Lab Grade Sheet Name /100 Table of Contents updated /300 Calculations shown /100 Materials & Procedure listed /500 Data Table clear and organized /100 Data signed & dated /300 Percent Error calculated /100 No Obliterated Data /500 Discussion /2000 Total

![Population%20dynamics%20equations[1]](http://s3.studylib.net/store/data/009173623_1-09271ff054ecf552593810773aee8fd9-300x300.png)


