Exp 1_NMR Spectroscopic Analysis of Butanol Isomers.doc
advertisement
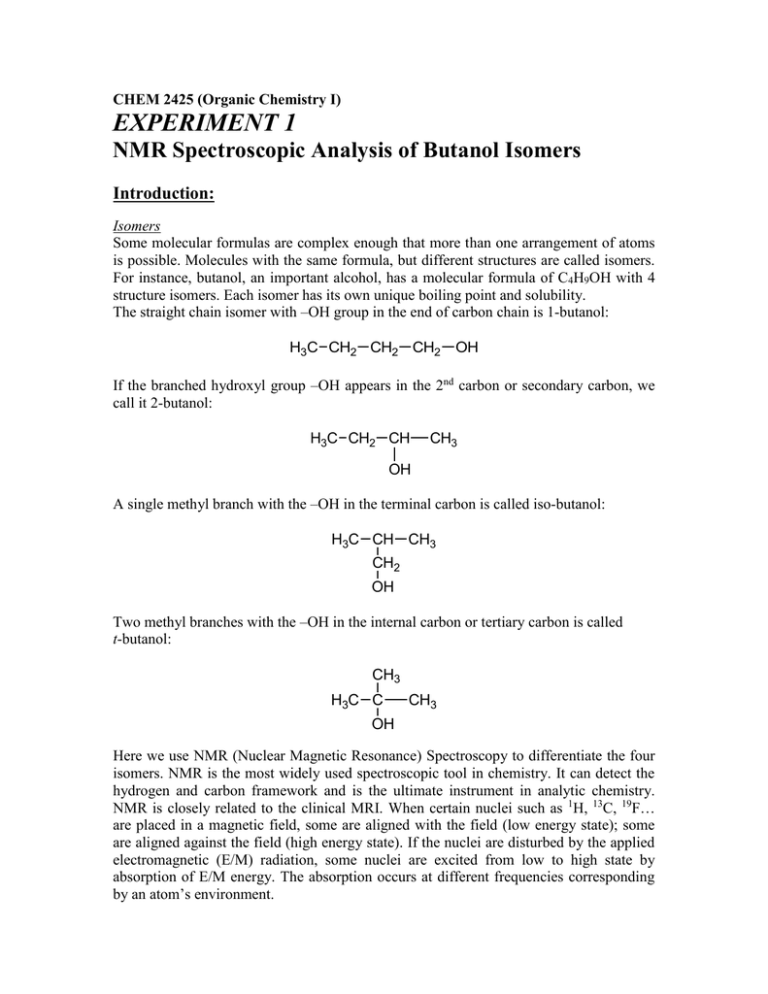
CHEM 2425 (Organic Chemistry I) EXPERIMENT 1 NMR Spectroscopic Analysis of Butanol Isomers Introduction: Isomers Some molecular formulas are complex enough that more than one arrangement of atoms is possible. Molecules with the same formula, but different structures are called isomers. For instance, butanol, an important alcohol, has a molecular formula of C4H9OH with 4 structure isomers. Each isomer has its own unique boiling point and solubility. The straight chain isomer with –OH group in the end of carbon chain is 1-butanol: H3C CH2 CH2 CH2 OH If the branched hydroxyl group –OH appears in the 2nd carbon or secondary carbon, we call it 2-butanol: H3C CH2 CH CH3 OH A single methyl branch with the –OH in the terminal carbon is called iso-butanol: H3C CH CH3 CH2 OH Two methyl branches with the –OH in the internal carbon or tertiary carbon is called t-butanol: CH3 H3C C CH3 OH Here we use NMR (Nuclear Magnetic Resonance) Spectroscopy to differentiate the four isomers. NMR is the most widely used spectroscopic tool in chemistry. It can detect the hydrogen and carbon framework and is the ultimate instrument in analytic chemistry. NMR is closely related to the clinical MRI. When certain nuclei such as 1H, 13C, 19F… are placed in a magnetic field, some are aligned with the field (low energy state); some are aligned against the field (high energy state). If the nuclei are disturbed by the applied electromagnetic (E/M) radiation, some nuclei are excited from low to high state by absorption of E/M energy. The absorption occurs at different frequencies corresponding by an atom’s environment. A typical NMR spectrum is a plot of absorption of energy versus frequency during resonance. After Fourier Transform, the frequency changes to “chemical shift” with unit of parts per million (ppm) and is plotted on the x-axis. 1 H NMR 1. Number of Peaks Each signal peak represents a single proton 1H or a group of equivalent protons. The number of signals equals to the number of groups of nonequivalent protons. In the case of t-butanol, all 9 protons in three methyl CH3 groups are equivalent; there should be only one signal peak corresponding to these 9 protons and one single peak for the proton in the OH group. In isobutanol, there are four non-equivalent groups – four peaks. In 1-butanol and 2-butanol, we should see 5 peaks. 2. Position of the Peaks – Chemical Shift The horizontal position of the peaks are called chemical shift, it is determined by the shielding and deshielding effect caused by the chemical environments of the protons. The chemical shift is towards to the right, we call it upfield, it is due to the shielding effect and the downfield shift is towards to the left and is due to the deshielding effect. In the case of isobutanol, the single proton in OH group comes into resonance downfield from the other protons. This is due to the electron-withdrawing effect of the oxygen atom. The electron cloud that surround the 1H nucleus usually screens the nucleus from the applied magnetic field, however the oxygen atom pulls away the electron cloud and deshield the nucleus, so the nucleus resonates in a lower magnetic field, the position appears at about 4.2 ppm. 3. Integrated Area – Number of Protons in a Group If the area under the peak is calculated (integrated area), it should be proportional to the number of protons contributed to the peak. In the case of t-butanol, the ratio between the two integrated peaks is 9:1, corresponding to the number of protons producing each peak. 4. Spin Coupling – Split of Peaks Because nuclei are little magnets, they influence each other, change the energy, hence the frequency of nearby nuclei as they resonate, cause the position shift a little from the original place so the overall signal peaks can be split into a few more little peaks. This phenomenon is called spin-spin interaction or spin coupling. The splitting of the peak represents the number of adjacent hydrogen. A peak will be split into n+1 peaks where n is the number of adjacent hydrogen. In order to show the clear resolution, the chemical shift must be greater than the spin-spin coupling, otherwise the NMR spectrum is going to be overlapped, this is the case for 1butanol and 2-butanol where the signals of –CH2 and -CH3 are stacked together around 1 ppm. 13 C NMR 1. Number of Peaks Each signal peak represents a single proton 13C or a group of equivalent carbons. The number of signals equals to the number of groups of nonequivalent carbons. In the case of t-butanol, all 3 carbons in three methyl CH3 groups are equivalent; there should be one signal peak corresponding to these 3 carbons and one single peak for the carbon connecting to the OH group. In isobutanol, there are three non-equivalent groups – three peaks. In 1-butanol and 2-butanol, we should see 4 peaks. 2. Position of the Peaks – Chemical Shift The horizontal position of the peaks are called chemical shift, it is determined by the shielding and deshielding effect caused by the chemical environments of the carbons. The demonstrations of 1H and 13C spectra are shown as following. 1-butanol: H3C CH2 CH2 CH2 1 H NMR 13 C NMR OH 2-butanol: H3C CH2 CH OH 1 H NMR 13 13C C NMR CH3 isobutanol: H3C CH CH3 CH2 OH 1 H NMR 13 C NMR t-butanol: CH3 H3C C OH 1 H NMR 13 C NMR CH3 Materials and Apparatus: Four NMR tubes, each one is filled with one type of butanol isomers (in DMSO-d6) 60MHz NMR spectrometer Procedure: 1H NMR Spectrum: (For Instructors: The system needs to be setup, following the steps of A, B, C in page 6 of the EFT 60MHz operation manual. If you choose to set up by yourself, please arrive 30 minutes prior to your class. Or call the office and let the lab assistants set up for you.) 1. 2. 3. 4. 5. Divide the entire class to four groups. Each group pick up one Unknown sample Turn on the Air Pump Turn the black Knob on top of the magnet, take out the existing sample. Remove the existing sample (the water sample) from the sample holder; place it on the sample rack. Use a paper napkin to hold the white plastic part of the sample holder, never use your hand to touch it. 6. Place your unknown sample into the sample holder. Again Use a Paper Napkin to hold the white part of the sample holder. 7. Turn the black knob to make the sample spinning. You may have to do it a couple of times to ensure that the sample tube is spinning. Use a penlight if necessary to look down the sample holder. 8. From the attached computer, switch to the PNMR program by clicking the PNMR icon. 9. Only the 1st group type a command: acq acq is a combination command of shim the magnet and acquire data. The other groups just type: zg zg is to acquire data. 10. When the dialog box appear in the screen, the spectra is obtained, switch to the NUTS program by click the icon of NUTS 11. In NUTS program, type Ctrl F1 (control f1) 12. When the dialog menu appears on the screen, type your unknown number and your group name, click OK 13. Your spectrum is printed out, do the corresponding analysis or comparison with existing spectra to determine the unknown structure. 14. Rotate to next students group, repeat steps from 4 to 13. 15. When all the groups acquire the spectra, remove the last sample from the magnet and replace it with the water sample (the original sample), stop the spin, turn off the air pump. You don’t have to log off the computer. 13C NMR Spectrum: 1. steps 1-8, the same as the 1H NMR spectrum. 2. Select 13C observe: if the prompt is H1> not C13>, switch to C13>; type nu C13 and hit Enter key: H1> nu C13 <Enter> 3. “shim” the magnet and set the parameters: C13> shim 4. Set the parameters: C13> ns 8 (number of scan : 8 times) C13> rg 16 (Relay Gain: 16) 5. Acquire data: C13> zg 6. Band Width: when the dialog box appear in the screen, enter 0.5 for the band width 7. The spectra is obtained, switch to the NUTS program by click the icon of NUTS 8. In NUTS program, type Ctrl F3 (control f3) 9. When the dialog menu appears on the screen, type your unknown number and your group name, click OK 10. Your spectrum is printed out, do the corresponding analysis or comparison with existing spectra to determine the unknown structure. 11. Rotate to next students group, repeat steps from 2 to 10. 12. When all the groups acquire the spectra, remove the last sample from the magnet and replace it with the water sample (the original sample), stop the spin, turn off the air pump. You don’t have to log off the computer. Report Form: NMR Spectrum of your butanol: (sketch or attach actual spectrum). Draw your butanol on the spectrum and identify the peaks. Post-lab questions: 1. Point out two identifying features from your spectrum that rule out other butanols. 2. What are the difference between resonance structures and isomers? Give examples. 3. Sketch the 1H and 13C NMR spectrum for acetone (CH3COCH3). Identify the peak(s). 4. There are exactly two isomers of the molecule C2H4F2. Draw both of them.

