Transforming Data with Z Score
advertisement
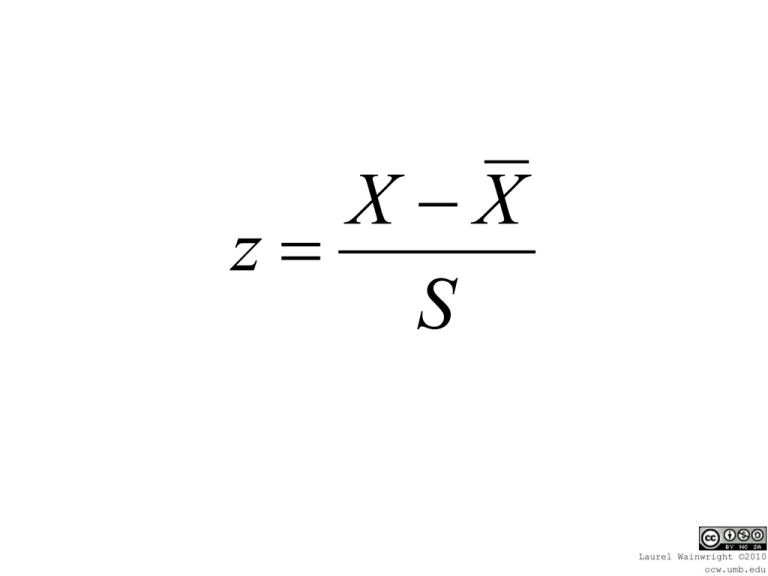
X X z S Assume that a certain child has both a reading and math score. How does this child’s performance in these two areas compare? Reading score: 28 Math score: 14 Reading: 28 mean: 25, St. Dev.: 4 Math: 14 mean: 13 St. Dev.: 1.5 X X z S 28 25 Z 4 3 Z 4 Z .75 Reading: 28 mean: 25, St. Dev.: 4 Math: 14 mean: 13 St. Dev.: 1.5 X X Z S 14 13 Z 1 .5 1 Z 1 .5 Z .67 34.13 % = 100 = 15 13.59 % 2.28% 70 85 100 115 130 34.13 % = 50 13.59 % = 7 2.28 % 36 43 50 57 64 = 35 =3 29 32 35 38 41 What % of the population would have scores that would fall at or below 29? = 35 =3 2.28% 29 32 35 38 41 X Z= 29 35 Z= 3 - 6 Z= 3 Z = -2 = 35 =3 2.28% 29 32 35 38 41 What % of the population would have scores above 36? 36 35 Z= 3 1 Z= 3 Z = .33 = 35 =3 29 32 35 38 36 41 If Z = 1.75 Z a column: Z score b column: % of area between the population mean and Z c column: % of area between the Z score and the tail of the distribution. b c If Z = 1.75 Z -Z If Z = -.80 b c -Z If Z = -.80 b c b c -Z Z = 35 =3 29 32 35 38 36 Z - .33 41 Prob. At z .33 = .1293 (col. B) This means that the percentage of times that a score would fall between the mean and a z score of .33 is 12.93% Prob at .33 = .3707 (col. C) 37.07% of the population falls beyond the z score of .33. What % of the population will have scores between 33 and 36? = 35 =3 29 32 35 33 38 36 41 Step 1: find z score for each Step 2: use table to find percentages. Step 3: add percentages 33 35 Z= 3 - 2 Z= 3 Z = - .66 Prob at .66 = .2454 .2454 + .1293 = .3747 or 37.47 %
