Episode 524: Stable nuclides (Word, 141 KB)
advertisement
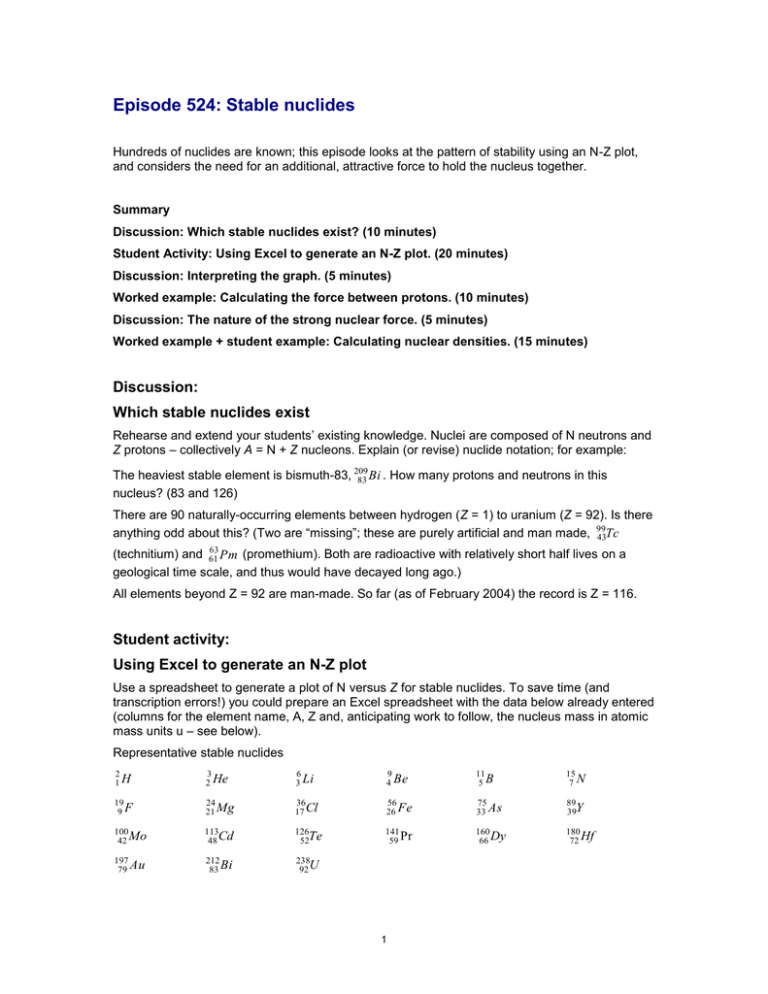
Episode 524: Stable nuclides Hundreds of nuclides are known; this episode looks at the pattern of stability using an N-Z plot, and considers the need for an additional, attractive force to hold the nucleus together. Summary Discussion: Which stable nuclides exist? (10 minutes) Student Activity: Using Excel to generate an N-Z plot. (20 minutes) Discussion: Interpreting the graph. (5 minutes) Worked example: Calculating the force between protons. (10 minutes) Discussion: The nature of the strong nuclear force. (5 minutes) Worked example + student example: Calculating nuclear densities. (15 minutes) Discussion: Which stable nuclides exist Rehearse and extend your students’ existing knowledge. Nuclei are composed of N neutrons and Z protons – collectively A = N + Z nucleons. Explain (or revise) nuclide notation; for example: The heaviest stable element is bismuth-83, 209 83 Bi . How many protons and neutrons in this nucleus? (83 and 126) There are 90 naturally-occurring elements between hydrogen (Z = 1) to uranium (Z = 92). Is there anything odd about this? (Two are “missing”; these are purely artificial and man made, 99 43Tc 63 (technitium) and 61 Pm (promethium). Both are radioactive with relatively short half lives on a geological time scale, and thus would have decayed long ago.) All elements beyond Z = 92 are man-made. So far (as of February 2004) the record is Z = 116. Student activity: Using Excel to generate an N-Z plot Use a spreadsheet to generate a plot of N versus Z for stable nuclides. To save time (and transcription errors!) you could prepare an Excel spreadsheet with the data below already entered (columns for the element name, A, Z and, anticipating work to follow, the nucleus mass in atomic mass units u – see below). Representative stable nuclides 2 1H 3 2 He 6 3 Li 9 4 Be 11 5B 15 7N 19 9F 24 21 Mg 36 17 Cl 56 26 Fe 75 33 As 89 39Y 100 42 Mo 113 48 Cd 126 52Te 141 59 Pr 160 66 Dy 180 72 Hf 197 79 Au 212 83 Bi 238 92 U 1 TAP 524-1: Stability: Balanced numbers of neutrons and protons Discussion: Interpreting the graph Describe the graph. (It is linear (N Z) up to Z ~ 20, then increasingly N > Z – there is a ‘neutron excess’. The neutron excess is crucial in explaining nuclear stability, and for setting up a chain reaction in the exploitation of nuclear energy. Think about the Coulomb repulsion between protons. What are the neutrons doing in there? (Neutrons must help overcome the strong repulsion between the protons, partly by ‘diluting them’, but also providing an attractive force to balance the electric repulsion. Hence the name strong nuclear force. Worked example: Calculating the force between protons If Coulomb’s law has been covered, calculate the repulsive force between two protons that just ‘touch’, so the separation of their centres r is the diameter of a proton (1.4 10-15 m). Fe 1 q1 q 2 where q1 = q2 = +e = 1.6 10-19 C 4 0 r 2 Fe ~ 100 N Discussion: The nature of the strong nuclear force Explain the need for the strong nuclear force to balance the Coulomb repulsion. This force must be attractive – it overcomes the coulomb repulsion; independent of electric charge – it acts between nn, pp and np; and very short range ~ 1fm = 10-15 m. Worked example + student example: Calculating nuclear densities Calculate the density of a nucleon: nucleon mass ~ 1.7 10-27 kg; radius ~ 1.4 10-15 m; density ~ 1.4 1017 kg m-3 This is enormous compared to the density of everyday matter. Ask your students to repeat the calculation for He-4 (or give data for other nuclides): Nuclide mass ~ 6.6 10-27 kg; radius ~ 2 10-15m; density ~ 1.6 1017 kg m-3 So the density is roughly the same for all nuclei. This is summed up in the relationship: r = r0 A1/3 with r0 = 1.4 fm 2 TAP 524-1: Stability: Balanced numbers of neutrons and protons Stable and unstable nuclei: balance of numbers of protons and neutrons stable alpha decay 150 beta decay electron capture positron emission fission 100 N= Z 50 0 0 20 40 60 80 100 proton number Z This plot of neutron number against proton number shows nuclei decay paths, and the trend of stable nuclei. 3 Practical advice The diagram could be used as an OHT and discussed in class External reference This activity is taken from Advancing Physics chapter 18, 50O 4
