Level three assessment task - unit standard 2787 (DOC, 64KB)
advertisement

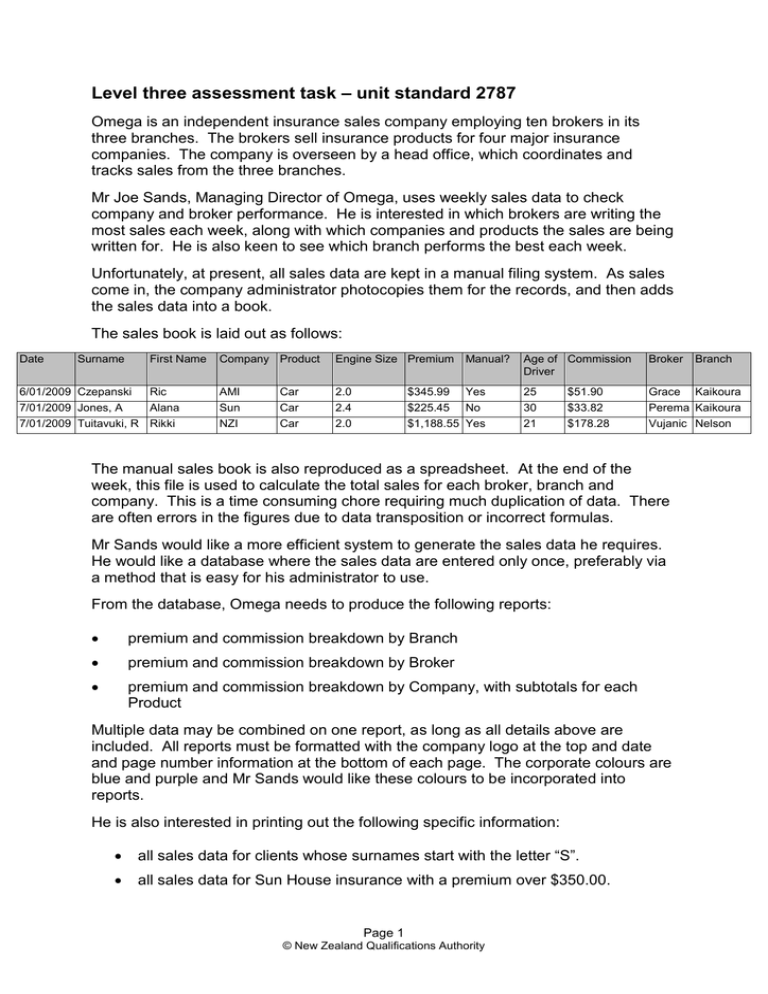
Level three assessment task – unit standard 2787 Omega is an independent insurance sales company employing ten brokers in its three branches. The brokers sell insurance products for four major insurance companies. The company is overseen by a head office, which coordinates and tracks sales from the three branches. Mr Joe Sands, Managing Director of Omega, uses weekly sales data to check company and broker performance. He is interested in which brokers are writing the most sales each week, along with which companies and products the sales are being written for. He is also keen to see which branch performs the best each week. Unfortunately, at present, all sales data are kept in a manual filing system. As sales come in, the company administrator photocopies them for the records, and then adds the sales data into a book. The sales book is laid out as follows: Date Surname 6/01/2009 Czepanski First Name Company Product Engine Size Premium Manual? Age of Commission Driver Broker Branch Ric AMI Car 2.0 $345.99 Yes 25 $51.90 Grace Kaikoura Sun NZI Car Car 2.4 2.0 $225.45 No $1,188.55 Yes 30 21 $33.82 $178.28 Perema Kaikoura Vujanic Nelson 7/01/2009 Jones, A Alana 7/01/2009 Tuitavuki, R Rikki The manual sales book is also reproduced as a spreadsheet. At the end of the week, this file is used to calculate the total sales for each broker, branch and company. This is a time consuming chore requiring much duplication of data. There are often errors in the figures due to data transposition or incorrect formulas. Mr Sands would like a more efficient system to generate the sales data he requires. He would like a database where the sales data are entered only once, preferably via a method that is easy for his administrator to use. From the database, Omega needs to produce the following reports: premium and commission breakdown by Branch premium and commission breakdown by Broker premium and commission breakdown by Company, with subtotals for each Product Multiple data may be combined on one report, as long as all details above are included. All reports must be formatted with the company logo at the top and date and page number information at the bottom of each page. The corporate colours are blue and purple and Mr Sands would like these colours to be incorporated into reports. He is also interested in printing out the following specific information: all sales data for clients whose surnames start with the letter “S”. all sales data for Sun House insurance with a premium over $350.00. Page 1 © New Zealand Qualifications Authority all sales data for the week of 13-17 January 2009. all sales data for AMI insurance sales for brokers Moana Grace and Kim Mony. As this information is for his use only, it does not need to be in report form but does need to be printed. As Mr Sands is a very busy man, the company administrator will be expected to use the database you create. To this end, you will need to write a simple user document with instructions as to how access and use the various areas of the database should be used. Keep it simple – no jargon or acronyms! The company administrator has provided a copy of the spreadsheet file to save you manually re-inputting the sales data. Create a brief for the project. Plan your database. In the plan you should ensure you identify the purpose and target users. The plan should also outline the specifications of your database. You must include size, data type, text and number format, Boolean, currency, integer, decimal and dates or times. Justify the model of database you have selected to fulfil the requirements of your brief. Create a plan of action that will outline how and when you will meet the brief. This should include any resources, key factors, constraints and stakeholders, including stakeholder consultation. Print off your tables, queries and reports. Evaluate the database to ensure it is fit for the purpose. Create a user document for the staff. Page 2 © New Zealand Qualifications Authority

