– 2011 Assessment Schedule
advertisement
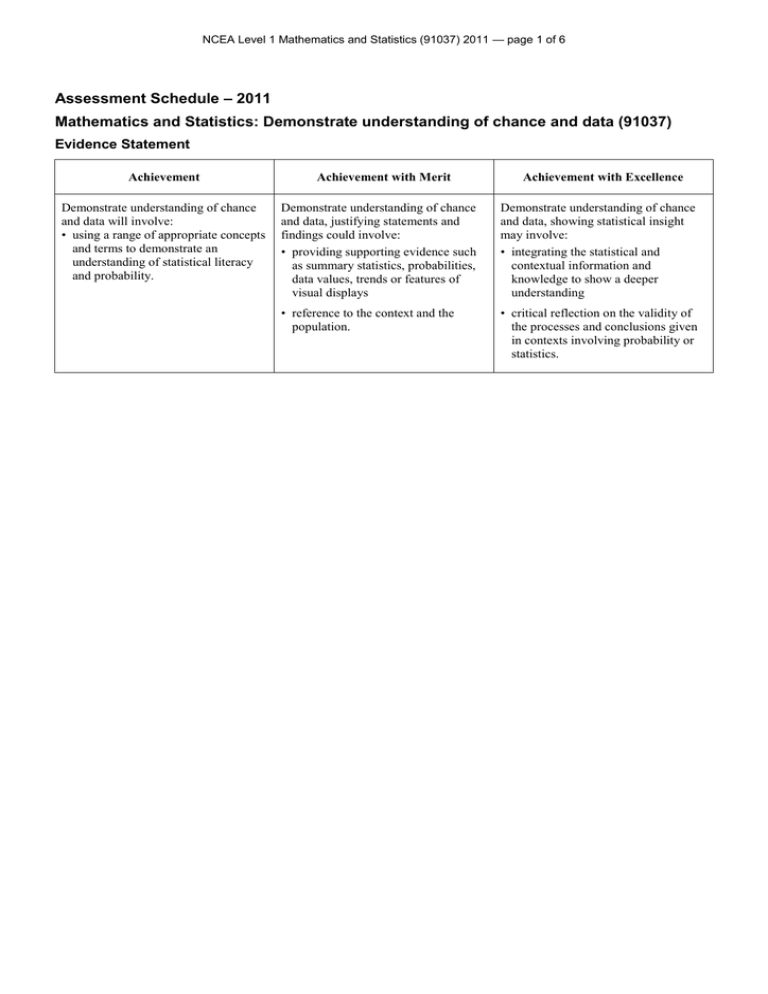
NCEA Level 1 Mathematics and Statistics (91037) 2011 — page 1 of 6 Assessment Schedule – 2011 Mathematics and Statistics: Demonstrate understanding of chance and data (91037) Evidence Statement Achievement Demonstrate understanding of chance and data will involve: • using a range of appropriate concepts and terms to demonstrate an understanding of statistical literacy and probability. Achievement with Merit Achievement with Excellence Demonstrate understanding of chance and data, justifying statements and findings could involve: • providing supporting evidence such as summary statistics, probabilities, data values, trends or features of visual displays Demonstrate understanding of chance and data, showing statistical insight may involve: • integrating the statistical and contextual information and knowledge to show a deeper understanding • reference to the context and the population. • critical reflection on the validity of the processes and conclusions given in contexts involving probability or statistics. NCEA Level 1 Mathematics and Statistics (91037) 2011 — page 2 of 6 Question ONE (a) (i) (ii) (iii) Evidence Achievement (u) Merit (r) Excellence (t) Demonstrate an understanding of chance and data. Demonstrate an understanding of chance and data, justifying statements and findings. Demonstrate an understanding of chance and data, showing statistical insight. Clearly explaining why a scattergraph is the best graph, but not linking it to the question under investigation. Clearly explaining why a scattergraph is the best graph to use to answer his question. 201 or 202 cm 160 cm 2 people Interpreting the scattergraph correctly in TWO out of the three cases. (b) A scattergraph is a good way of spreading out the points so that if there is a relationship between the arm-span and the height, as he wants to find out, it should be possible to see it. Noting that a scattergraph enables you to see outliers or clusters. (c) Unlikely points: (160,60), (173,80), (105,160), and (160,106), (127,163) approx. Identifying TWO points that seem to be impossible. It seems highly unlikely that a person could have a height of 160 (173), but an arm-span of only 60 (80) (106) cm (since one average arm is usually about this long). OR If a person was 105 (127) cm tall (which is very short) you would not expect their arm-span to be the same as people who are 50 to 70 cm taller than them. (d) Sufficiency Identifying TWO points that seem to be impossible, and giving a sensible explanation for each identification. Points that could be made in favour: • The LOBF does pass along the line y = x so it does say that armspan is roughly the same height. • The medians and the means for both sets of numbers are similar. • He has surveyed a good number of people. Points that could be made against: • The LOBF is not in the middle of the data, so it is not really valid. • He should clean the data before he makes any conclusion as there are obviously some unlikely points being included. • He cannot make any general conclusion just by surveying year 10 students: he needs a more representative sample. • He should separate data from boys and girls as the relationship may be different for the two genders. Makes the conclusion of YES, and cites at least ONE reason clearly and in a way that directly relates to this context, N1: 1 u N2: 2 u A3: 3 u A4: 4 u Relates comment to line of best fit in a valid way OR Makes the conclusion of YES, and cites at least TWO reasons clearly and in a way that directly relates to this context Makes any 2 of the 3 points listed under Merit OR OR Makes the conclusion of NO, and cites only ONE reason clearly and in a way that directly relates to this context. Makes the conclusion of NO, and cites at least TWO reasons clearly and in a way that directly relates to this context. M5: 2 r M6: 3 r E7: 1 t E8: 2 t NCEA Level 1 Mathematics and Statistics (91037) 2011 — page 3 of 6 NCEA Level 1 Mathematics and Statistics (91037) 2011 — page 4 of 6 Question Evidence TWO (a)(i) Letter A K N R Achievement Frequency 6 7 6 6 Merit Excellence Noting an issue with sample size being too small but not connecting it to reliability. Clearly relating the sample size to the reliability of the probability. Accurately summarising the collected data. (ii) 7 OR 7 : 18 25 OR equivalent OR reasoned other solution. Correctly or consistently calculating the probability. (iii) The probability is not likely to be very reliable because: Sample responses • Table suggests distribution is uniform so 28%, being close to 25%, seems valid Commenting on the apparent uniform distribution. • Finding dockets that may not have been issued on the days she found them. • Comment on sample size – too small to produce a trustworthy result • People are only discarding letters they already have. OR Making one valid observation about the limitations of this set of data. • The data suggests that there may be patterns in how certain letters come up (K’s seem to come in pairs). • N’s occur at the start of each set of 5, suggesting that there may be some pattern in the letter on the docket depending on the day of the week. (b) (c)(i) 13 Mean = 10.4 Median = 9 Mode = 8 Accept the same average calculated with and without the obvious outlier of 22. (ii) Median is probably the best choice in this case, as the mean is influenced by the one larger value. However, the mode might be useful to Alice because it tells her what quite often happens. An average calculated without the outlier could also be justified as the best one to use. (iii) This is not a valid simulation because this dice makes the letter A come up 3 times as often as N, K or R, but the supermarket says that they are equally likely to come up. Sufficiency N1: 1 u N2: 2 u Processing the set of data correctly. Obtaining ONE correct, labelled average, OR Two correct but unlabelled averages Obtaining more than ONE correct, labelled average Valid choice made but justification is unclear but correct in essence. Justifying choice of average in a valid way. A3: 3 u A4: 4 u Noting that the probabilities are not equally likely but not giving details. Criticising the experiment based on the actual situation. M5: 2 r M6: 3 r E7: 1 t E8: 2 t NCEA Level 1 Mathematics and Statistics (91037) 2011 — page 5 of 6 Questio n Evidence Achievement THREE (a) No: Both max and min are generally higher in Nairobi much of the year. Correctly interpreting the graphs of the maximum or minimum temperatures. Major peaks in both cases: Rome: max and min in JulySept, Nairobi: max in Feb, min in Apr. Also minor peaks in Nairobi (max in Oct, min in Nov), and peaks are in phase in Rome but not in Nairobi. Loose or vague description of peaks and troughs in the temperatures. (c) No: much less variation over the year in Nairobi in both max and min temperatures. Correctly interpreting the variation of the maximum or minimum temperatures. (d) No: there is no discernible rise in either set of temperatures. Clearly noting that there is a trend (as opposed to variation) but deciding that it is upward or downward. Correctly interpreting the trend in the graphs of the maximum or minimum temperatures. (e) Yes: the difference between the maximum and minimum temperatures is usually lower in Rome (8-10o), than in Nairobi (10-14o). Loosely interpreting the difference between the maximum and minimum temperatures in each city. Clearly interpreting the difference between the maximum and minimum temperatures in each city. (f) Recommendations: Nairobi: If you like predictable temperatures over the year with a smaller variation in temperature each month. Rome: If you like more variation between summer and winter temperatures, but less variation in temperature each month. Recommending one city with a justification based on the graphs OR making a vague comparison between the 2 cities OR Making no comparison between the cities. Recommending one city with a valid, clear justification based on the graphs and making a clear comparison between the 2 cities. (f) Qualifications: The temperature is not the only measure that you might want: you should find out about the rainfall and wind (or other factors) before you make a final decision. There may be a lot of variation in temperature within each month in one city, but we don’t see that as we only have the plot for the averages. Making ONE valid qualification with a valid justification Making TWO valid qualifications to the recommendation, but with one vague or unclear justification. Making TWO valid qualifications to the recommendation, whether it is noting a limitation in the data or suggesting further research that should be done. N1: 1 u N2: 2 u A3: 3 u A4: 4 u M5: 2 r M6: 3 r E7: 1 t E8: 2 t (b) Sufficien cy OR Merit Correctly describing the major seasonal effects in the graphs of the maximum or minimum temperatures. Making TWO valid qualifications to the recommendation, but with no justifications Excellence Correctly describing one finer detail in the seasonal effects in the graphs of the maximum or minimum temperatures. NCEA Level 1 Mathematics and Statistics (91037) 2011 — page 6 of 6 Judgement Statement Score range Not Achieved Achievement Achievement with Merit Achievement with Excellence 0–8 9 – 13 14 – 18 19 – 24
