STA 6208 – Exam 3 – Spring 2012 – PRINT...
advertisement
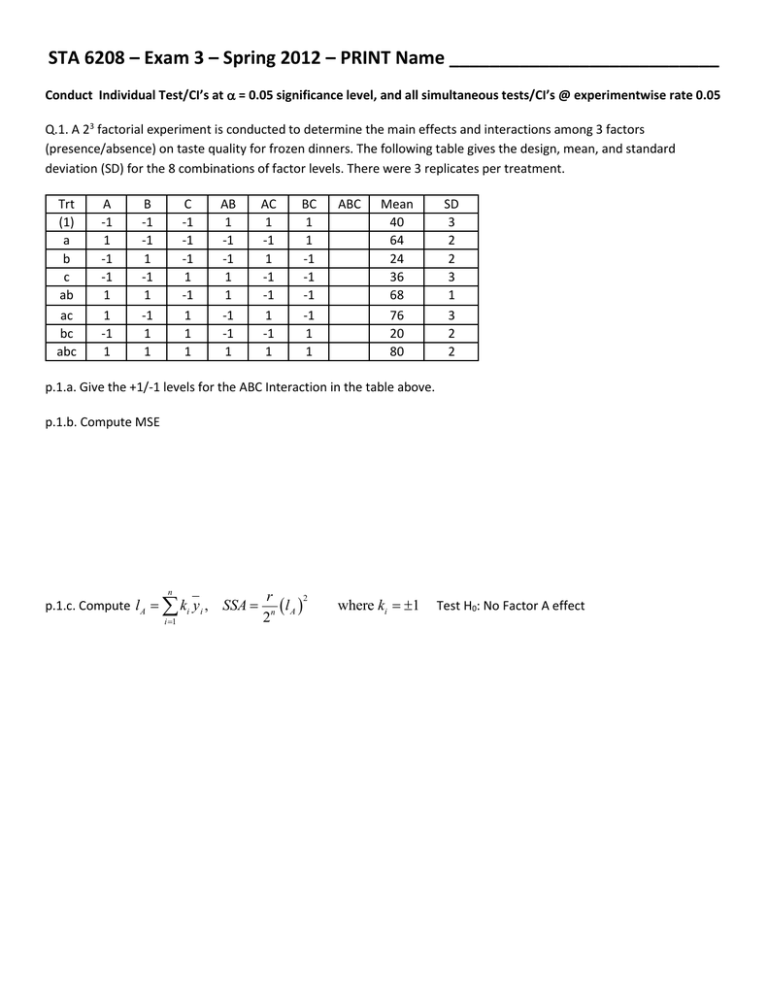
STA 6208 – Exam 3 – Spring 2012 – PRINT Name ___________________________ Conduct Individual Test/CI’s at = 0.05 significance level, and all simultaneous tests/CI’s @ experimentwise rate 0.05 Q.1. A 23 factorial experiment is conducted to determine the main effects and interactions among 3 factors (presence/absence) on taste quality for frozen dinners. The following table gives the design, mean, and standard deviation (SD) for the 8 combinations of factor levels. There were 3 replicates per treatment. Trt (1) a b c ab ac bc abc A -1 1 -1 -1 1 1 -1 1 B -1 -1 1 -1 1 -1 1 1 C -1 -1 -1 1 -1 1 1 1 AB 1 -1 -1 1 1 -1 -1 1 AC 1 -1 1 -1 -1 1 -1 1 BC 1 1 -1 -1 -1 -1 1 1 ABC Mean 40 64 24 36 68 76 20 80 SD 3 2 2 3 1 3 2 2 p.1.a. Give the +1/-1 levels for the ABC Interaction in the table above. p.1.b. Compute MSE p.1.c. Compute l A n k y , i 1 i i SSA r 2 l n A 2 where ki 1 Test H0: No Factor A effect Q.2. An experimenter wishes to conduct a taste experiment to determine whether there are differences in the 6 recipes that are to be compared. He plans to have individuals serve as blocks and taste items from the various recipes. However, he knows that individuals have a difficult time choosing a favorite as the number of choices increases. He has selected a sample of 10 raters, and has decided that each will choose his/her favorite among 3 recipes. Complete the following parts, where t = # trts, b=# blocks, r = reps/trt, k = block size, = 3 blocks each pair of treatments appear in together. p.2.a. t = ___________ b = ___________ r = ___________ k = ___________ = ___________ p.2.b. Put a check in each appropriate cell for this design to meet the criteria in part p.2.a. Recipe1 Recipe2 Recipe3 Recipe4 Recipe5 Recipe6 Rater1 Rater2 Rater3 Rater4 Rater5 Rater6 Rater7 Rater8 Rater9 Rater10 Q.3. A study was conducted as a Latin Square design with 5 packages (treatments), in 5 stores (Rows), over 5 weeks (Columns). The response was number of packages sold in a week. The Error sum of squares was reported to be 600. Compute Tukey’s HSD and Bonferroni’s MSD for comparing all pairs of package means. Q.5. A study compared 3 foods on serum glucose levels. A sample of 12 subjects were selected, and randomized such that 4 people received Food A, 4 received Food B, and 4 received Food C. Each subject’s glucose levels were observed at 3 time points after eating the meal (15, 30, and 45 minutes). p.5.a. Complete the following ANOVA table. Source Food Subject(Food) Time Food*Time Error2 Total df SS MS F F(.05) Significant? 1020.67 413.33 170.17 869.67 128.17 2602.00 p.5.b. The means for each food/time combination are given below. Use Bonferroni’s method to compare all pairs of food, separately for each time (treat each time as a separate “family”, when making adjustment). Food\Time 1 2 3 Time 1: Food1 1 19 22 26 2 35 20 27.25 Food2 Food3 3 31.5 11.5 35.75 Time 2: Food2 Food3 Food1 Time 1: Food2 Food1 Food3 Q.6. A study was conducted to compare 5 Nitrogen levels (0, 45, 90, 135, 180 kg/hectare) and Rice Straw (Absent/Present) on Rice Grain Yield (100s of kg/hectare). The experiment was conducted as a split-plot design, with whole plot factor being Nitrogen level, and sub-plot factor being Rice Straw. The experiment was conducted in 3 blocks (Years). p.6.a. Complete the following Analysis of Variance Table. ANOVA Source WP Block WP*Block SP WP*SP Error Total df SS MS F F(.05) 5693.63 216.82 60.18 110.82 0.96 6098.94 p.6.b. Assuming no significant Nitrogen/Rice Straw Interaction, compute Bonferroni’s Minimum significant Difference for comparing pairs of Nitrogen level effects. Show which levels are significantly different. Nitrogen 0 45 90 135 180 Mean 48.65 75.19 79.07 85.85 85.96 Rice Straw 0 1 Bonferoni MSD = ________________________ Mean 73.02 76.87 Nit0 Nit45 Nit90 Nit135 Nit180 p.6.c. Compute a 95% Confidence Interval for the effect of Using Rice Straw, versus not using rice straw.
