Fall 2013 - Exam 3
advertisement
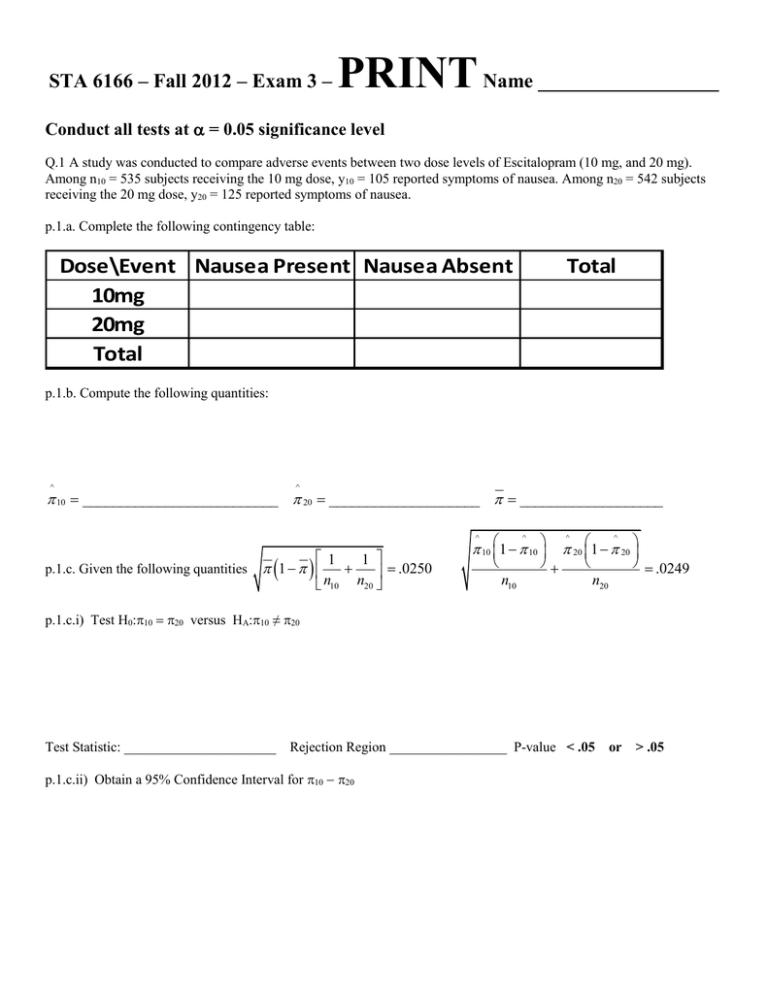
STA 6166 – Fall 2012 – Exam 3 – PRINT Name __________________ Conduct all tests at = 0.05 significance level Q.1 A study was conducted to compare adverse events between two dose levels of Escitalopram (10 mg, and 20 mg). Among n10 = 535 subjects receiving the 10 mg dose, y10 = 105 reported symptoms of nausea. Among n20 = 542 subjects receiving the 20 mg dose, y20 = 125 reported symptoms of nausea. p.1.a. Complete the following contingency table: Dose\Event Nausea Present Nausea Absent 10mg 20mg Total Total p.1.b. Compute the following quantities: ^ ^ 10 __________________________ 20 ____________________ ___________________ 10 1 10 20 1 20 n10 n20 ^ p.1.c. Given the following quantities 1 1 .0250 n10 n20 1 ^ ^ ^ .0249 p.1.c.i) Test H0: versus HA:≠ Test Statistic: ______________________ Rejection Region _________________ P-value < .05 p.1.c.ii) Obtain a 95% Confidence Interval for or > .05 Q.2. An ergonomic study was conducted to compare computer keyboard preferences among 5 keyboards by gender. A sample of 66 females, and a sample of 36 males were obtained, and each participant selected their preferred keyboard.: Gender\Keyboard Female Male Total Kybrd1 11 4 15 Kybrd2 15 8 23 Kybrd3 22 10 32 Kybrd4 10 6 16 Kybrd5 Total 8 66 8 36 16 102 Expected Female Male Total Kybrd1 Kybrd2 14.88 8.12 Kybrd3 20.71 11.29 Kybrd4 10.35 5.65 Kybrd5 Total 10.35 5.65 p.2.a. Complete the table of expected values p.2.b. Compute the Chi-square statistic by completing the following table and give the rejection region for testing whether the distribution of damages differs by extinguisher presence/absence (H0: No association): Chi-Square Female Male Total Kybrd1 Test Statistic______________________ Kybrd2 0.001 0.002 0.003 Kybrd3 0.081 0.148 0.229 Kybrd4 0.012 0.022 0.034 Kybrd5 Total 0.535 #N/A 0.980 #N/A 1.515 Reject H0 if test statistic __________________________________ Q.3.A two factor experiment was conducted in a RCBD. Factor A had 4 levels, factor B had 3 levels, and there were 6 blocks. Give the sources and degrees of freedom for the analysis of variance table. Q.4. In a random sample of n = 100 adult fish from a large lake, y = 63 have a particular genetic trait. Test whether a majority of all adult fish in the lake have the trait. H0: ≤ 0.50 versus HA: > 0.50 Test Statistic: ______________________________ Rejection Region: _________________________________ Q.5. A study of the largest ski resorts in Scotland looked at whether event of ski injury was related to whether or not it was the participants first day at the resort (FDP). The following table gives the results. Obtain the estimated Odds Ratio, and its 95% Confidence Interval, where: OR Group\Outcome First Day Participant Not First Day Injured 381 1743 odds(Injury|FDP) odds(Injury|non-FDP) Uninjured 144 1638 Hint: (1/381) + (1/144) + (1/1743) + (1/1638) = .01075 Estimated Odds Ratio: _______________________ 95%CI: _____________________________________ Does this study provide evidence of an association between first day participation and injury? Yes or No Q.6.A study was conducted to compare the energy efficiencies among a=3 clothing types b=4 dryer types. There were 3 replicates for each combination of clothing type and dryer type. The cell means and marginal means are given below. Clothes\Dryer 1 2 3 Overall 1 1.179 1.439 1.292 1.303 2 1.248 1.437 1.346 1.344 3 2.180 2.302 2.283 2.255 4 1.557 1.669 1.536 1.587 Overall 1.541 1.712 1.614 1.622 p.5.a. Complete the following ANOVA table. Source Treatments Clothes Dryers Clothes*Dryers Error Total df SS 5.442 0.176 5.230 5.601 p.5.b. Use Bonferroni’s method to compare all pairs of Dryer types. MS #N/A F_obs #N/A F(0.05) #N/A #N/A #N/A #N/A #N/A #N/A


