Fall 2011 - Exam 2
STA 6166 – Exam 2 – Fall 2011 PRINT Name ________________________
True or False:
Q.1. All else being equal, as the number of treatments increase, the width of individual confidence intervals will decrease when we apply Bonferroni’s method of simultaneous confidence intervals.
Q.2. When conducting Wilcoxon’s Signed-Rank test correctly, we will have
T
+
+ T
-
= n +1
Q.3. A confidence interval for a population variance can include both positive and negative values.
Problems:
Q.4. A chemist is interested in comparing the variation of chemical purity for the 2 suppliers her lab purchases the chemical from. She takes random samples of 9 vials from each supplier, and observes sample standard deviations of 10.0 for supplier 1 and 7.0 for supplier 2. p.4.a. Give the test statistic for testing H
0
:
1
2
=
2
2
versus H
A
:
1
2
≠
2
2
(
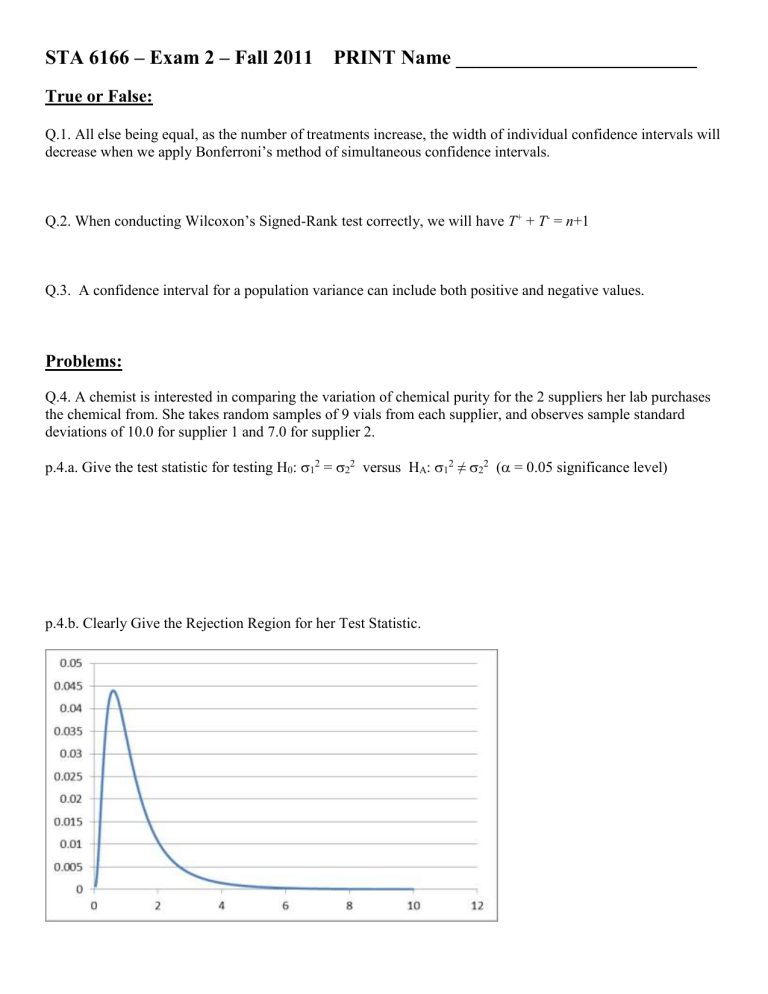
= 0.05 significance level) p.4.b. Clearly Give the Rejection Region for her Test Statistic.
Q.5. A researcher wants to compare the effects of 3 advertisements on consumers’ attitude toward a new consumer product. He obtains 60 consumers, and randomly assigns 20 to each of the advertisements (each consumer is only exposed to one of the ads). After viewing the advertisement, each person is asked to rate his/her feelings toward the product on a visual analogue scale, where higher scores are more favorable. The results (means, standard deviations, and sample sizes) are given below.
Ad
1 n
20
Mean
7.0
SD
1.5
2
3
20
20
5.5
4.0
1.6
1.4
p.5.a. Compute the Between treatment sum of squares and its corresponding degrees of freedom
Between Treatment Sum of Squares ______________________ Degrees of Freedom ____________ p.5.b. Compute the Within treatment sum of squares and its corresponding degrees of freedom
Within Treatment Sum of Squares ______________________ Degrees of Freedom ____________ p.5.c. Test H
0
: No differences among the true ad means (
) versus:
vs H
A
: Differences exist among true ad means (Not all
i
are equal) (
significance level) p.5.c.i. Test Statistic: p.5.c.ii. Clearly state Rejection Region: __________________________________________________
Q.6. A researcher is interested in comparing the coloring of 2 automotive painting machines. She samples n =12 sheets of aluminum, and she cuts each sheet into 2 parts. One part was painted with machine A, the other part was painted with machine B. A measure of paint quality was obtained from each half of each sheet. Data are given below.
10
11
12
7
8
9
Sheet Machine A Machine B Diff (A-B)
1 61.42
62.00
-0.58
2
3
4
5
6
57.64
60.66
57.75
57.85
59.99
60.63
59.02
57.06
56.05
61.13
-2.99
1.63
0.70
1.80
-1.14
66.90
56.45
57.83
62.75
53.48
57.69
64.24
62.39
56.79
60.10
53.33
60.44
2.66
-5.94
1.04
2.65
0.14
-2.75
Mean 59.20
59.43
-0.23
Std Dev 3.44
3.10
2.60
p.6.a. Compute a 95% Confidence Interval for the difference between the true mean scores for the 2 machines
(
D
) by completing the following parts: p.6.a.i. (Point) Estimate: ___________________ p.6.a.ii. Estimated Std. Error ________________________ p.6.a.iii. Critical t-value ___________________ p.6.a.iv. 95% CI: _________________________________ p.6.b. Compute T
+
and T
-
for the Wilcoxon Signed-Rank test p.6.c. For a 2-sided (
= 0.05) test, we reject the null hypothesis of equal medians if min( T
+
, T
) ≤ 13. Do we reject the null hypothesis? Yes / No
Q.7. A scientist is interested in comparing the duration of lifetimes of insects exposed to 4 varieties of pesticides. He runs a Completely Randomized Design with 10 insects per variety of pesticide (thus, a total of
N=40). Due to some outliers, he decides to use the Kruskal-Wallis test. You are given the following partial results (Hint: 1+2+…+n = n(n+1)/2).
Pesticide (i) Rank Sum (T_i)
1 200
2
3
180
225 p.7.a. Compute T
4
___________________________
4 p.7.b. Test H
0
: No differences among the 4 varieties’ medians versus H
A
: Differences exist at
= 0.05 significance level. p.7.b.i. Compute the test statistic (there were no “ties” among the data)
Test Statistic = __________________________________ p.7.b.ii. Clearly state the rejection region _____________________________________________ p.7.b.iii. The P-value will be (circle one) > 0.05 < 0.05 Need More Information
Q.8. An experiment is conducted as a Randomized Block Design, and you obtain the following partial Analysis of Variance Table.
Source DF SS MS F F(.05) Conclude Effects???
Treatments
Blocks
Error
5
6
1500
3600 #N/A #N/A
60 #N/A #N/A
Yes / No
#N/A
#N/A
Total #N/A #N/A #N/A #N/A
p.8.a. Complete the table. p.8.b. Number of treatments = _____ p.8.c. Number of blocks = ____ p.8.d. Number of observations = ____
Q.9. A researcher reports the Relative Efficiency of a Randomized Block Design, relative to a Completely
Randomized Design of 5. The Randomized Block Design had 5 treatments and 8 blocks. How many observations would be needed to have as precise of estimates of treatment means, if the experiment was conducted as to a Completely Randomized Design? p.10.a. observations per treatment = ________________ p.10.b. total number of observations _________
Q.10. Compute Bonferroni’s Minimum Significant Difference (B ij
) for each of the following experiments (all with experimentwise error rate of 0.05): p.10.a. Completely Randomized Design: t = 4 treatments, n = 7 replicates per treatment, MSE = 500 p.10.b. Randomized Block Design: t = 3 treatments, b = 11 blocks, MSE = 80
