Exam 2 - Fall 2004
advertisement
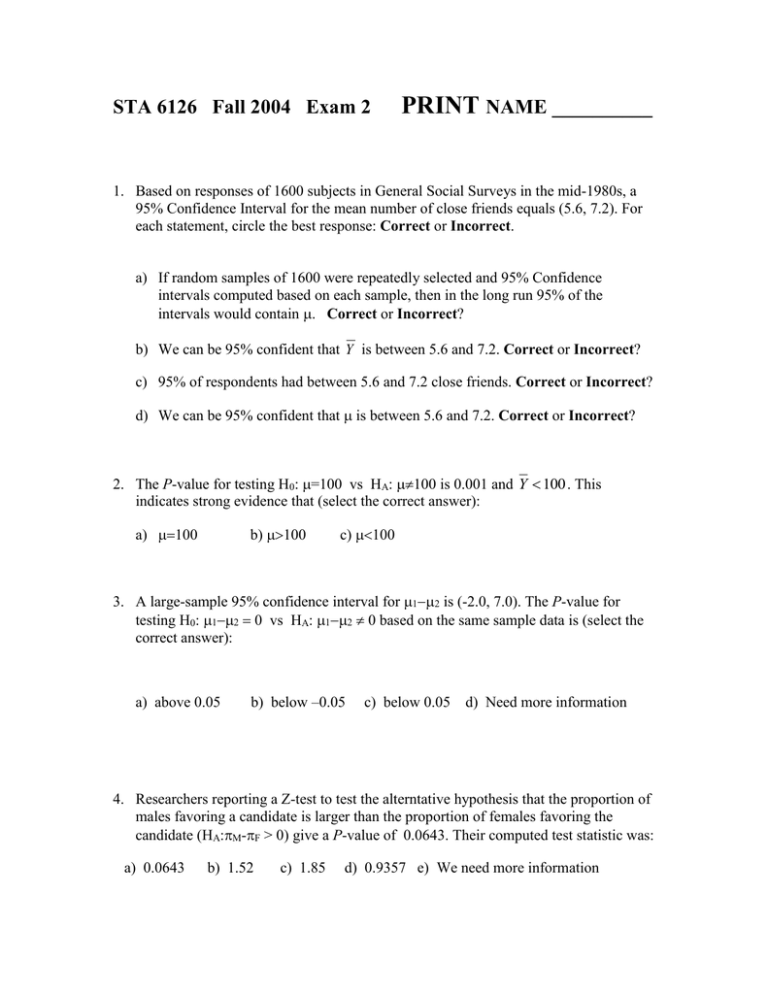
STA 6126 Fall 2004 Exam 2 PRINT NAME __________ 1. Based on responses of 1600 subjects in General Social Surveys in the mid-1980s, a 95% Confidence Interval for the mean number of close friends equals (5.6, 7.2). For each statement, circle the best response: Correct or Incorrect. a) If random samples of 1600 were repeatedly selected and 95% Confidence intervals computed based on each sample, then in the long run 95% of the intervals would contain . Correct or Incorrect? b) We can be 95% confident that Y is between 5.6 and 7.2. Correct or Incorrect? c) 95% of respondents had between 5.6 and 7.2 close friends. Correct or Incorrect? d) We can be 95% confident that is between 5.6 and 7.2. Correct or Incorrect? 2. The P-value for testing H0: =100 vs HA: 100 is 0.001 and Y 100 . This indicates strong evidence that (select the correct answer): a) b) c) 3. A large-sample 95% confidence interval for is (-2.0, 7.0). The P-value for testing H0: 0 vs HA: 0 based on the same sample data is (select the correct answer): a) above 0.05 b) below –0.05 c) below 0.05 d) Need more information 4. Researchers reporting a Z-test to test the alterntative hypothesis that the proportion of males favoring a candidate is larger than the proportion of females favoring the candidate (HA:M-F > 0) give a P-value of 0.0643. Their computed test statistic was: a) 0.0643 b) 1.52 c) 1.85 d) 0.9357 e) We need more information For each of the following problems, give the null and alternative hypotheses (be very careful in notation with respect to symbols and subscripts) 5. Researchers believe that when faced with the question: “Do you have a favorable attitude toward President Bush”?, men are more likely to respond “Yes” than women. 6. A researcher wishes to demonstrate that the mean time to read a paragraph differs, depending on the color of the paper that the paragraph is printed on (White vs Red). Following section not covered yet For each of the following problems, state whether the samples are best described as independent or dependent (paired) samples and whether the responses are numeric or nominal for each subject. 7. A study is conducted to determine whether two training methods differ for employees learning a new computer system. Among new employees who have no experience with the system, half receive training method 1, the others receive training method 2, and a skills test based on the number of correctly completed of 20 tasks is given after training. 8. A wine company has a sample of subjects taste their wine twice. Once when the bottle is said to be $15, once when it’s said to be $8. Under each condition, they are asked if they like the taste of the wine. (Yes/No). Subjects are not aware the wine is the same under the two conditions. Solved Problems: 9. A pharmaceutical scientist is interested in estimating the adverse event rate () of patients taking a psychotropic drug. She samples 100 patients at random and gives them the drug, 20 report an adverse event. a) Give a point estimate for the adverse event rate: b) Give a 95% confidence interval for the true adverse event rate in the population c) Using your point estimate as a “starting value” in the standard error equation, how many subjects would be needed to estimate the true adverse event rate within 0.01 with probability 0.95? 10. A social scientist wants to determine whether average clothing expenditures differ among two cultural groups. They randomly sample 12 individuals from each group, obtaining annual clothing expenditures from each (incomes are similar among all surveyed individuals, but they are NOT paired). The following table gives the sample statistics (assume population standard deviations are equal): Grp 1 Grp 2 n 12 12 Mean 5000 3000 Std Dev 1000 800 a) Give the test statistic for testing H0: 1-2 = 0 vs HA: 1-2 0 b) Sketch the P-value, and clearly identify the distribution and values that correspond to the P-value, based on your answer to Part a). c) For your test and test statisic in Part a), you will conclude (based on =0.05): if the test statistic falls in the range: ______________ if the test statistic falls in the range: ______________ and are not significantly different if test statistic is in range:____________ NOT COVERED YET Computer Output Based and Pre-Solved Problems: 11. The following output gives SPSS output from a paired difference t-test, to determine whether Botox reduces intensity of migraine scores after treatment, compared to before treatment. Data for each of n=29 subjects is the difference between pre- and post-treatment migraine intensity scores. Paired Samples Statistics Mean Pair 1 PREINT N Std. Deviation Std. Error Mean 8.862 29 .9533 .1770 3.03 29 3.669 .681 POSTINT Pa ired Sa mpl es Test Paired Differences Pair 1 PREINT - POSTINT Mean 5.828 St d. Deviat ion 3.9827 St d. Error Mean .7396 95% Confidenc e Int erval of t he Difference Lower Upper 4.313 7.343 We wish to test H0: D = 0 vs HA: D 0, give the following quantities/conclusions: D _______________ sD = ________________ sD n _______________ tobs = ________________ P-value: ____________________ 95% CI for D: _________________ Conclusion (=0.05): i) Botox has no effect on migraine intensity. ii) Botox increases migraine intensity iii) Botox decreases migraine intensity t 7.880 df 28 Sig. (2-tailed) .000 NOT COVERED YET 12. A movie producer wants to determine whether a movie preview changes movie fans intentions to view the producer’s new film. Movie fans are exposed to a brief description of movie: title, director, stars. They are then asked whether they believe they will view the film. After having been exposed to other questions/stimuli, the subjects see a preview of the movie, and are again asked viewing intentions. The following table gives the results. Will Go Won’t Go Will go 100 40 Will not go 20 200 Before Preview \ AfterPreview Use the McNemar Z-test to determine whether the probability of a viewer will say they will go to the movie is different before or after they see the preview, based on =0.05 significance level. (H0: B = A vs HA: B A) a) Test Statistic: b) P-value: c) Conclusion (Circle one): i. Cannot conclude proportions saying they will go differ ii. Conclude more likely to say they will go before seeing preview iii. Conclude more likely to say they will go after seeing preview 13. Independent random samples of 500 males and 500 females were obtained, and each asked whether they believe in afterlife. Of the males, 340 replied Yes, while 420 females replied Yes. Labelling M the population proportion of all adult males who believe in the afterlife, and F the propulation proportion of all adult females believing in the afterlife, compute a 95% Confidence Interval for M-F.


