Logs 1.3 The Definition
advertisement
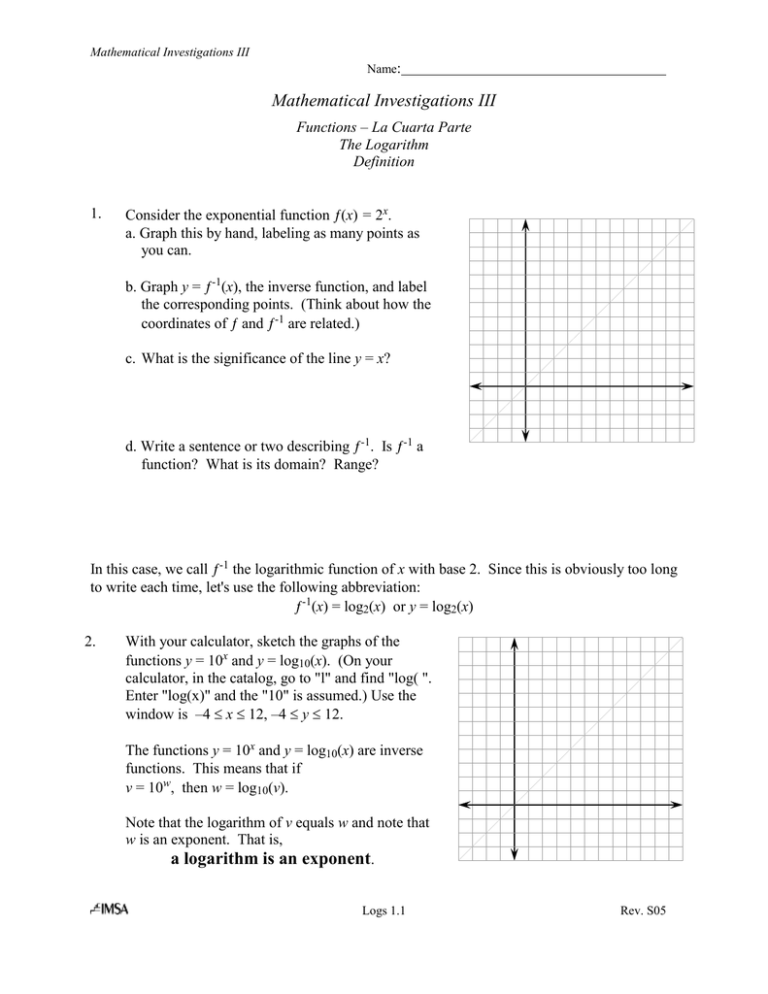
Mathematical Investigations III Name: Mathematical Investigations III Functions – La Cuarta Parte The Logarithm Definition 1. Consider the exponential function ƒ(x) = 2x. a. Graph this by hand, labeling as many points as you can. b. Graph y = ƒ-1(x), the inverse function, and label the corresponding points. (Think about how the coordinates of ƒ and ƒ-1 are related.) c. What is the significance of the line y = x? d. Write a sentence or two describing ƒ-1. Is ƒ-1 a function? What is its domain? Range? In this case, we call ƒ-1 the logarithmic function of x with base 2. Since this is obviously too long to write each time, let's use the following abbreviation: ƒ-1(x) = log2(x) or y = log2(x) 2. With your calculator, sketch the graphs of the functions y = 10x and y = log10(x). (On your calculator, in the catalog, go to "l" and find "log( ". Enter "log(x)" and the "10" is assumed.) Use the window is –4 x 12, –4 y 12. The functions y = 10x and y = log10(x) are inverse functions. This means that if v = 10w, then w = log10(v). Note that the logarithm of v equals w and note that w is an exponent. That is, a logarithm is an exponent. Logs 1.1 Rev. S05 Mathematical Investigations III Name: 3. Consider the exponential function ƒ(x) = ex. a. Graph the function and label 3 points. b. Let g(x) = ln(x) = ƒ-1(x), the inverse function. Sketch the graph of y = g(x) and label three points. ( ln(x) stands for "Natural Logarithm" which has base e.) c. Write a sentence or two describing ƒ-1. Is ƒ-1 a function? What is its domain? Range? In problems 1 – 3, what are the x and y intercepts for the exponential graphs? logarithmic graphs? Definition of a Logarithm: logba = c if and only if bc = a, a > 0, b > 0, b 1 OR logbase (number) = exponent if and only if (base)exponent = number, number > 0, base > 0, base 1 Examples: Since Since log5 (25) = 2 because 52 25 log2(256) = 8 because 28 256 93/2 = 27, 3431/3 = 7, log9(27) = 3/2 log343(7) = 1/3 Rewrite the following logarithmic equations as exponential equations and write the exponential equations as logarithmic equations. log3(81) = 4 7 3 343 log 4 0.25 1 logx(y) = z 36(1/2) = 6 ea = b Logs 1.2 Rev. S05 Mathematical Investigations III Name: An Application of Logarithms D = Day A = Amount (mg) When data values increase rapidly, the graph sometimes grows too high, too fast to visualize clearly. For example, a certain bacteria culture grows at a rate shown by the amounts in the table. Consider the result when you take the log of each y = A coordinate. D = Day Extend the table above by using your calculator to compute values for a new column, a new y-coordinate L = log(A), as the log of the old y-coordinate, A. 1 0.2 4 1.6 7 13 10 103 13 820 15 3300 19 52400 A = Amount (mg) 1 0.2 4 1.6 7 13 10 103 13 820 15 3300 19 52400 L = log(A) L = log(A) Now use your new table to graph the first and third columns, (Day, log(Amount)) = (D, log(A)). Write an equation L as a function of D. D = Day Rewrite your equation by substituting log(A) for L. Use the definition of a logarithm to transform the equation to solve for A in terms of D. Logs 1.3 Rev. S05
