item2 bbcs ppstatus
advertisement

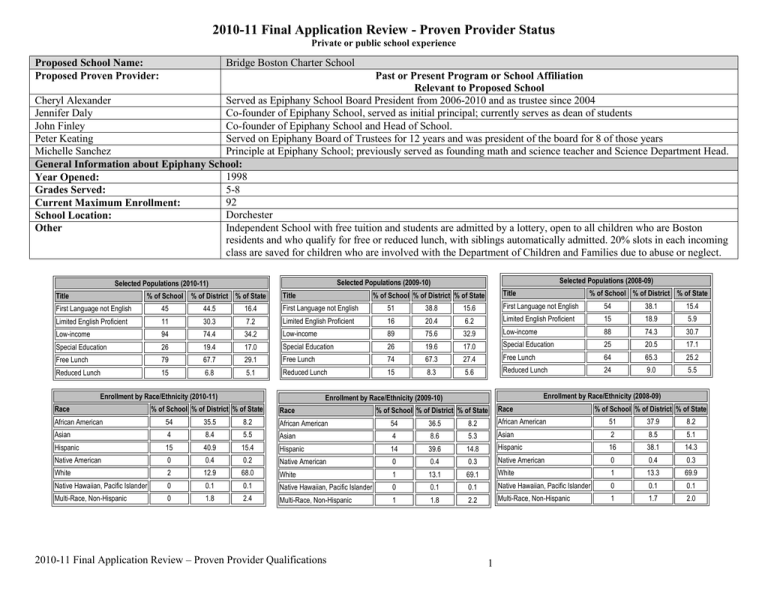
2010-11 Final Application Review - Proven Provider Status Private or public school experience Bridge Boston Charter School Proposed School Name: Proposed Proven Provider: Past or Present Program or School Affiliation Relevant to Proposed School Cheryl Alexander Served as Epiphany School Board President from 2006-2010 and as trustee since 2004 Jennifer Daly Co-founder of Epiphany School, served as initial principal; currently serves as dean of students John Finley Co-founder of Epiphany School and Head of School. Peter Keating Served on Epiphany Board of Trustees for 12 years and was president of the board for 8 of those years Michelle Sanchez Principle at Epiphany School; previously served as founding math and science teacher and Science Department Head. General Information about Epiphany School: 1998 Year Opened: 5-8 Grades Served: 92 Current Maximum Enrollment: Dorchester School Location: Independent School with free tuition and students are admitted by a lottery, open to all children who are Boston Other residents and who qualify for free or reduced lunch, with siblings automatically admitted. 20% slots in each incoming class are saved for children who are involved with the Department of Children and Families due to abuse or neglect. Title % of School % of District % of State First Language not English 45 44.5 Selected Populations (2008-09) Selected Populations (2009-10) Selected Populations (2010-11) 16.4 Title Title % of School % of District % of State First Language not English 51 38.8 % of School % of District % of State 15.6 First Language not English 54 38.1 15.4 15 18.9 5.9 Limited English Proficient 11 30.3 7.2 Limited English Proficient 16 20.4 6.2 Limited English Proficient Low-income 94 74.4 34.2 Low-income 89 75.6 32.9 Low-income 88 74.3 30.7 17.0 Special Education 25 20.5 17.1 64 65.3 25.2 24 9.0 5.5 Special Education 26 19.4 17.0 Special Education 26 19.6 Free Lunch 79 67.7 29.1 Free Lunch 74 67.3 27.4 Free Lunch Reduced Lunch 15 6.8 5.1 Reduced Lunch 15 8.3 5.6 Reduced Lunch Enrollment by Race/Ethnicity (2010-11) Race Enrollment by Race/Ethnicity (2008-09) Enrollment by Race/Ethnicity (2009-10) % of School % of District % of State Race % of School % of District % of State 51 37.9 8.2 8.6 5.3 Asian 2 8.5 5.1 14 39.6 14.8 Hispanic 16 38.1 14.3 0 0.4 0.3 Native American 0 0.4 0.3 13.1 69.1 White 1 13.3 69.9 0.1 0.1 Native Hawaiian, Pacific Islander 0 0.1 0.1 1.8 2.2 Multi-Race, Non-Hispanic 1 1.7 2.0 35.5 8.2 Asian 4 8.4 5.5 Asian 4 Hispanic 15 40.9 15.4 Hispanic Native American 0 0.4 0.2 Native American White 2 12.9 68.0 White 1 Native Hawaiian, Pacific Islander 0 0.1 0.1 Native Hawaiian, Pacific Islander 0 Multi-Race, Non-Hispanic 0 1.8 2.4 Multi-Race, Non-Hispanic 1 2010-11 Final Application Review – Proven Provider Qualifications % of School % of District % of State African American 54 African American Race 8.2 African American 54 36.5 1 All Epiphany Students-- Stanford 10 Reading Test Percentiles CLASS OF: Years at Epiphany 2010 (4 years) 2011 (3 years) 2012 (2 years) Incoming 5th Grade percentile 25% 47% 32% Most recent Percentile Total percentile Change Change in Percentile Per Epiphany Year 53% (8th grade) 59% (7th grade) 48% (6th grade) 28% 12% 16% 7% 4% 8% All Epiphany Students-- Stanford 10 Math Test Percentiles CLASS OF: Years at Epiphany 2010 (4 years) 2011 (3 years) 2012 (2 years) Incoming 5th Grade Percentile 31% 52% 47% Most recent Percentile Total Percentile Change 61% ( 8th grade) 66% (7th grade) 62% (6th grade) 30% 14% 15% Change in Percentile Per Epiphany Year 7% 4% 8% All Epiphany Students-- Stanford 10 Language Test Percentiles CLASS OF: Years at Epiphany 2010 (4 years) 2011 (3 years) 2012 (2 years) Incoming 5th Grade Percentile 37% 47% 33% Most recent Percentile Total Percentile Change 59% (8th grade) 70% (7th grade) 53% (6th grade) 22% 23% 20% Change in Percentile Per Epiphany Year 5% 7% 10% Epiphany Students who are Black--Stanford 10 Reading Test Percentiles CLASS OF: Years at Epiphany 2010 (4 years) 2011 (3 years) 2012 (2 years) Incoming 5th Grade Percentile 25% 45% 35% Most recent Percentile Total Percentile Change 54% 58% 48% 29% 13% 13% Change in Percentile Per Epiphany Year 7% 4% 7% Epiphany Students who are Black--Stanford 10 Math Test Percentiles CLASS OF: Years at Epiphany 2010 (4 years) 2011 (3 years) 2012 (2 years) Incoming 5th Grade Percentile 31% 47% 47% Most recent Percentile Total Percentile Change 62%` 63% 62% 31% 16% 15% 2010-11 Final Application Review – Proven Provider Qualifications Change in Percentile Per Epiphany Year 7% 5% 8% 2 Epiphany Students who are Black--Stanford 10 Language Arts Test Percentiles CLASS OF: Years at Epiphany 2010 (4 years) 2011 (3 years) 2012 (2 years) Incoming 5th Grade Percentile 38% 44% 33% Most recent Percentile Total Percentile Change 59% 70% 53% 21% 26% 20% Change in Percentile Per Epiphany Year 5% 8% 10% Epiphany Students have Special Needs--Stanford 10 Reading Test Percentiles CLASS OF: Years at Epiphany 2010 (4 years) 2011 (3 years) 2012 (2 years) Incoming 5th Grade Percentile 17% 43% 11% Most recent Percentile Total Percentile Change 45% 59% 25% 28% 16% 14% Change in Percentile Per Epiphany Year 7% 5% 7% Epiphany Students who have Special Needs--Stanford 10 Math Test Percentiles CLASS OF: Years at Epiphany 2010 (4 years) 2011 (3 years) 2012 (2 years) Incoming 5th Grade Percentile 19% 23% 23% Most recent Percentile Total Percentile Change 47% 55% 35% 27% 22% 12% Change in Percentile Per Epiphany Year 7% 7% 6% Epiphany Students who have Special Needs--Stanford 10 Language Arts Test Percentiles CLASS OF: Years at Epiphany 2010 (4 years) 2011 (3 years) 2012 (2 years) Incoming 5th Grade Percentile 20% 11% 10% Most recent Percentile Total Percentile Change 46% 80% 24% 26% 69% 14% 2010-11 Final Application Review – Proven Provider Qualifications Change in Percentile Per Epiphany Year 7% 23% 7% 3


