Figure 2-1. Applicants’ Regions of Origin, Percentages
advertisement
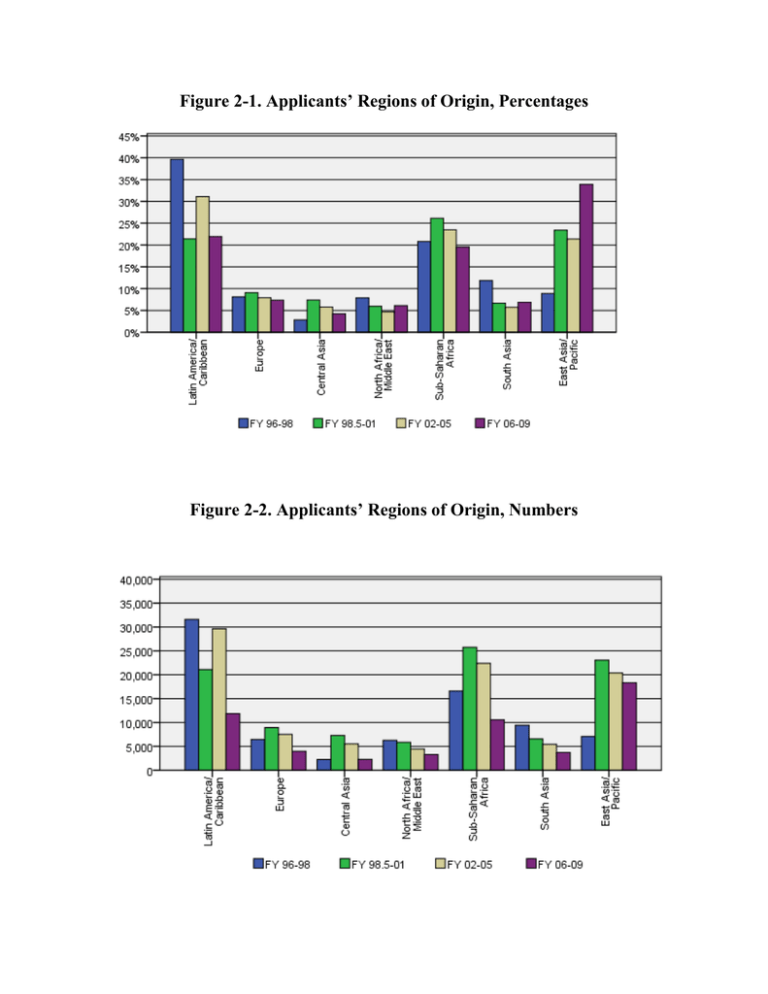
Figure 2-1. Applicants’ Regions of Origin, Percentages Figure 2-2. Applicants’ Regions of Origin, Numbers Figure 2-3. Principal Countries of Origin, FY 1995–1998 El Salvador , 17% Guatemala, 10% Other, 51% India, 9% Haiti, 7% China, 6% Figure 2-4. Principal Countries of Origin, FY 1998.5–2001 China, 16% Haiti, 10% Other, 55% Colombia, 8% Somalia, 7% Armenia, 4% Figure 2-5. Principal Countries of Origin, FY 2002–2005 China, 16% Colombia, 13% Other, 52% Haiti, 11% Cameroon, 4% 4% Indonesia, Figure 2-6 Principal Countries of Origin, FY 2006–2009 Other, 48% China, 31% Haiti, 9% Indonesia, 4% Ethiopia, 4% Colombia, 4% Figure 2-7. Percentage of Applicants Who Were Female Figure 2-8. Major Religions (>1%) of Applicants Who Stated a Religion 80,000 70,000 60,000 50,000 40,000 30,000 20,000 10,000 0 Christian Muslim FY96-98 Buddhist FY98.5-01 FY02-05 Sikh FY06-09 Jewish Figure 2-9. Age at Filing 50% 40% 30% 20% 10% 0% 0-17 18-29 FY96-98 30-39 FY98.5-01 FY02-05 40-49 50-99 FY06-09 Figure 2-10. Percentage of Applicants with Dependents in U.S. 25% 20% 15% 10% 5% 0% FY96-98 FY98.5-01 FY02-05 FY06-09 Figure 2-11. Percentage of Applicants Who Were Represented 70% 60% 50% 40% 30% 20% 10% 0% FY96-98 FY98.5-01 FY02-05 FY06-09 Figure 2-12. Percentage of Applicants Who Were Inspected (that is, entered the U.S. lawfully) 80% 70% 60% 50% 40% 30% 20% 10% 0% FY96-98 FY98.5-01 FY02-05 FY06-09 Figure 2-13. Ethnicity of Asylum Officers Trained at FLETC, 2003–2008 Figure 2-14. Ages of Asylum Officers at FLETC Training Did Not Respond, 7% Over 51, 12% 21-30, 34% 41-50, 16% 31-40, 31% Figure 2-15. Degrees Achieved by Asylum Officers Trained at FLETC, 2003–2008 No response or other, 13% Bachelors, 13% Associate, 1% Ph.D., 0% Masters, 14% JD, 59% Figure 2-16. Languages Other Than English Spoken by Asylum Officers Trained at FLETC, 2003–2008 Five or more, 3% Four, 7% None, 15% Three, 15% Two, 24% One, 36% Figure 2-17. Ethnicity of Asylum Officers Surveyed by Asylum Office, 2011 Asian/ Pacific, 9% No Response , 18% Other, 7% Native American, 1% Hispanic, 11% Black, 6% White, 48% Figure 2-18. Years of Service of the Asylum Officers Surveyed by Asylum Office, 2011 Figure 2-19 Post-secondary Education of Respondents Surveyed by Asylum Office, 2011 Figure 2-20. Officers’ Estimated Percentages of Asylum Cases Involving Persecution by a Government Figure 2-21. Percentage of Cases Estimated to Involve Past Persecution
