Lecture Note 18
advertisement
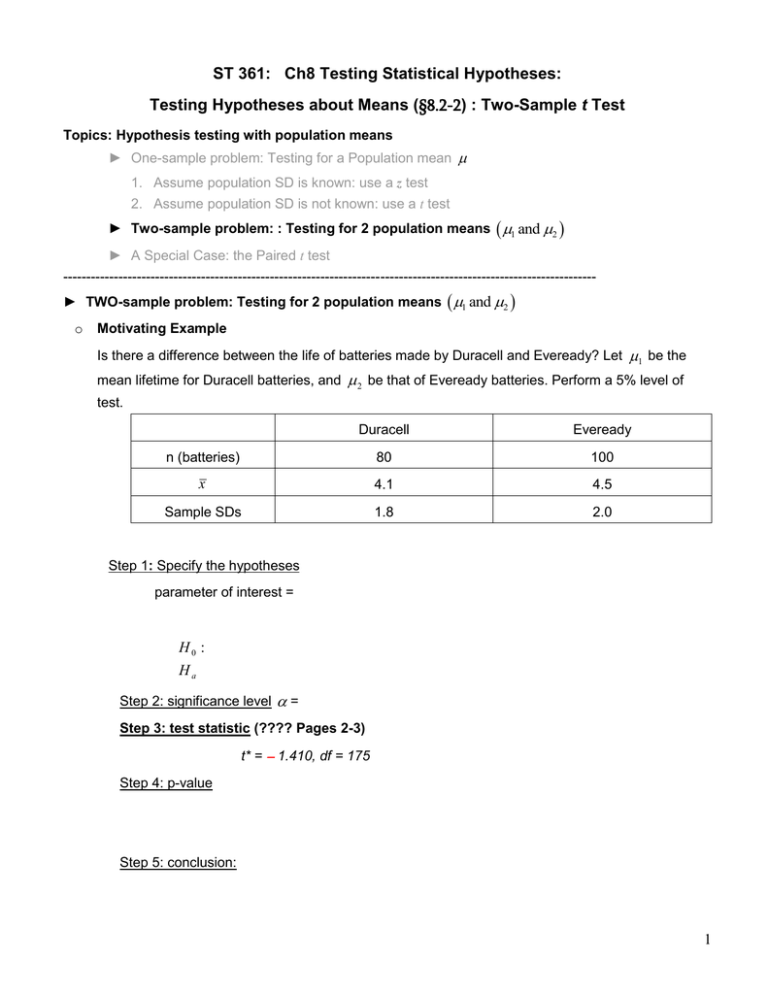
ST 361: Ch8 Testing Statistical Hypotheses: Testing Hypotheses about Means (§8.2-2) : Two-Sample t Test Topics: Hypothesis testing with population means ► One-sample problem: Testing for a Population mean 1. Assume population SD is known: use a z test 2. Assume population SD is not known: use a t test ► Two-sample problem: : Testing for 2 population means 1 and 2 ► A Special Case: the Paired t test -------------------------------------------------------------------------------------------------------------------► TWO-sample problem: Testing for 2 population means 1 and 2 o Motivating Example Is there a difference between the life of batteries made by Duracell and Eveready? Let 1 be the mean lifetime for Duracell batteries, and 2 be that of Eveready batteries. Perform a 5% level of test. Duracell Eveready n (batteries) 80 100 x 4.1 4.5 Sample SDs 1.8 2.0 Step 1: Specify the hypotheses parameter of interest = H0 : Ha Step 2: significance level = Step 3: test statistic (???? Pages 2-3) t* = 1.410, df = 175 Step 4: p-value Step 5: conclusion: 1 o Calculating the Test Statistics for Testing Two Means Need x1 x2 ~ Normal We will focus on the case that 1 and 2 are not known Test statistic is _________________________________________________________ ____________________________________________________________________ When the population SD’s 1 and 2 are NOT known, use ______________________ _____________ and hence work with a _____ test. SE1 2 SE2 2 4 4 SE1 SE2 n1 1 n2 1 And df = 2 (round down!!!) where SE1 s1 s and SE2 2 n1 n2 Note that the test statistic should be consistent with your hypotheses. That is, if your hypotheses are stated in terms of H 0 : 2 1 = 0 (as opposed to 1 2 ) , then the corresponding test statistic should be t* (Back to the battery example) Step 3: test statistic Note that df SE1 2 SE2 2 4 4 SE1 SE2 n1 1 n2 1 2 175.5 2 o Summary of the testing procedure for two population means: Step (1) Hypotheses H 0 : 1 2 _____ vs. H a : 1 2 _______ (lower-tail test) H a : 1 2 _______ (upper-tail test) H a : 1 2 _______ (two-sided test) Step (2) Significance level Step (3) Test statistic t* With df = Step (4) P-value = x1 x2 1 2 x1 x2 c s12 s 22 n1 n2 SE1 2 SE2 2 4 4 SE1 SE2 n1 1 n2 1 2 _______________ _______________ _______________ (a) s12 s 22 n1 n2 where SE1 s1 s and SE2 2 n1 n2 if H a : 1 2 c if H a : 1 2 c if H a : 1 2 c Conclusion: Reject H 0 if p-value < , and draw conclusion according to H a Otherwise do not reject H 0 , and draw conclusion according to H 0 3 Ex. Mary can take either a scenic route to work or a non-scenic route. She decides that use of nonscenic route can be justified only if it reduces true average travel time by more than 10 min. (a) If 1 refers to the scenic route and 2 to the non-scenic route, what hypotheses should be tested? (b) What should be the test statistic for testing your hypothesis? x x 1 2 x x 1 2 (1) t * 1 2 (2) t * 2 1 2 s1 n1 2 s2 2 s1 n2 n1 2 s2 n2 x x 2 1 x x 2 1 (3) t * 1 2 (4) t * 2 1 2 s1 n1 2 s2 2 s1 n2 n1 2 s2 n2 (c) If 1 refers to the non-scenic route and 2 to the scenic route, what hypothesis should be tested? (d) What should be the test statistic for testing your hypothesis? x x 1 2 x x 1 2 (1) t * 1 2 (2) t * 2 1 2 s1 n1 2 s2 2 s1 n2 n1 2 s2 n2 x x 2 1 x x 2 1 (3) t * 1 2 (4) t * 2 1 2 s1 n1 2 s2 2 s1 n2 n1 2 s2 n2 4 Ex. Many people take ginkgo supplements advertised to improve memory. Are these over-the-counter supplements effective? In a study, elderly adults were assigned to the treatment group or control group. The 104 participants who were assigned to the treatment group took 40 mg of ginkgo 3 times a day for 6 weeks. The 115 participants assigned to the control group took a placebo pill 3 times a day for 6 weeks. At the end of 6 weeks, the Wechsler Memory Scale was administered. Higher scores indicate better memory function. Summary values are given in the following table: N x s Ginkgo 104 5.7 0.6 Placebo 115 5.5 0.6 Based on these results, is there evidence that taking 40mg of ginkgo 3 times a day is effective in increasing mean performance on the Wechsler Memory Scale? Note that df SE1 2 SE2 2 4 4 SE1 SE2 n1 1 n2 1 2 214.81 Step 1: parameter of interest = H0 : Ha Step 2: significance level = Step 3: test statistic = Step 4: p-value = Step 5: Conclusion: 5 Ex. Consider an experiment involving the comparison of the mean heart rate following 30 minutes of aerobic exercise among females aged 20 to 24 years as compared to females aged 30-34 years. For this experiment, 10-second heart rates are recorded on each participant following 30 minutes of intense aerobic exercise and converted to beats per minute (i.e., heart rate per 60 seconds). The sample data are given below: Age 20-24 Age 30-34 Sample size 15 10 Sample mean 150.22 141.10 Sample SD 40.0 10.0 SE SE = 16.522 Here df 2 2 2 1 2 n1 1 n2 1 SE1 2 SE2 2 (a) What assumptions do we need in to have the mean difference follow a normal distribution? (b) Is the mean heart rate for the age group 20-24 more than that for the age group 30-34 by 5 beats per minute? Use =0.05. 6

