How_to_use_it.doc
advertisement

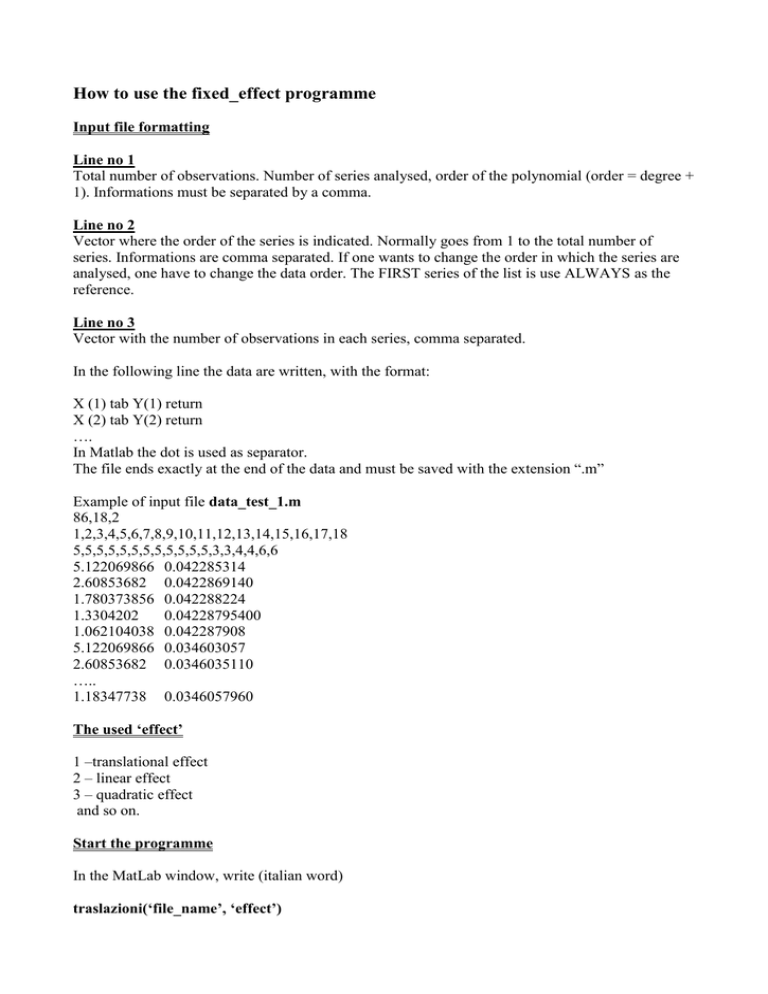
How to use the fixed_effect programme Input file formatting Line no 1 Total number of observations. Number of series analysed, order of the polynomial (order = degree + 1). Informations must be separated by a comma. Line no 2 Vector where the order of the series is indicated. Normally goes from 1 to the total number of series. Informations are comma separated. If one wants to change the order in which the series are analysed, one have to change the data order. The FIRST series of the list is use ALWAYS as the reference. Line no 3 Vector with the number of observations in each series, comma separated. In the following line the data are written, with the format: X (1) tab Y(1) return X (2) tab Y(2) return …. In Matlab the dot is used as separator. The file ends exactly at the end of the data and must be saved with the extension “.m” Example of input file data_test_1.m 86,18,2 1,2,3,4,5,6,7,8,9,10,11,12,13,14,15,16,17,18 5,5,5,5,5,5,5,5,5,5,5,5,3,3,4,4,6,6 5.122069866 0.042285314 2.60853682 0.0422869140 1.780373856 0.042288224 1.3304202 0.04228795400 1.062104038 0.042287908 5.122069866 0.034603057 2.60853682 0.0346035110 ….. 1.18347738 0.0346057960 The used ‘effect’ 1 –translational effect 2 – linear effect 3 – quadratic effect and so on. Start the programme In the MatLab window, write (italian word) traslazioni(‘file_name’, ‘effect’) the file_name is written without the extension “.m” The results In the same folder,a file with the same name of the analysed file is created, with the addition “_out”.


