Zooplankton in Ships Entering Puget Sound
advertisement
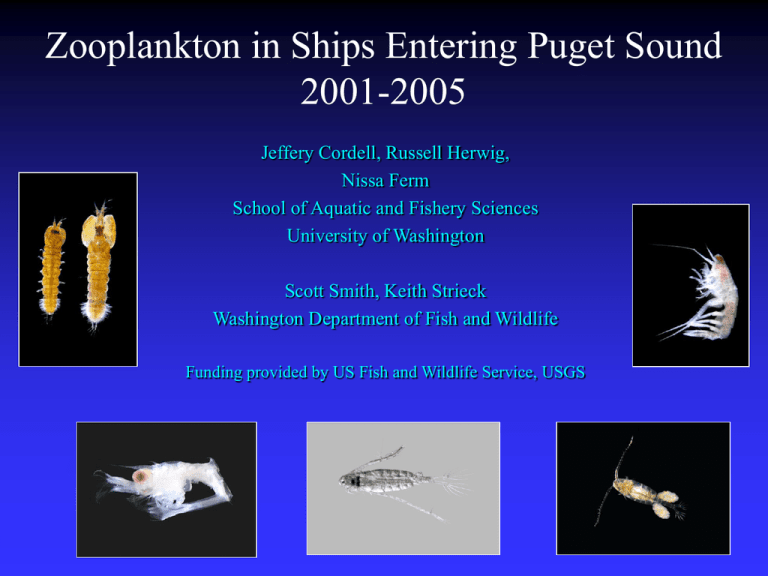
Zooplankton in Ships Entering Puget Sound 2001-2005 Jeffery Cordell, Russell Herwig, Nissa Ferm School of Aquatic and Fishery Sciences University of Washington Scott Smith, Keith Strieck Washington Department of Fish and Wildlife Funding provided by US Fish and Wildlife Service, USGS Barnacles Octopus Bivalves Meroplankton Only larvae live in the water column. Decapods (crabs, shrimps) Polychaetes Copepods Larvaceans Holoplankton Jelly Plankton Complete life history takes place in the water column. Cladoceran Other Crustaceans Mysid Shrimp Percent composition of holoplankton ≥ 73 µm in San Francisco Bay, March, 1998 Acartia (Acartiura) spp. Indigenous Plankton Taxa Limnoithona tetraspina Oithona davisae Other Asian Calanoids Eurytemora affinis Species of Non-indigenous copepods in San Francisco Bay Cyclopoida Limnoithona sinensis Limnoithona tetraspina Oithona davisae Calanoida Pseudodiaptomus forbesi Pseudodiaptomus marinus Sinocalanus doerri Acartiella sinensis Tortanus dextrilobatus Percent composition of holoplankton ≥ 73 µm in San Francisco Bay, May, 1998 Indigenous Plankton Taxa Limnoithona tetraspina Oithona davisae Other Asian Calanoids Species of Non-indigenous copepods in San Francisco Bay Cyclopoida Limnoithona sinensis Limnoithona tetraspina Oithona davisae Calanoida Pseudodiaptomus forbesi Pseudodiaptomus marinus Sinocalanus doerri Acartiella sinensis Tortanus dextrilobatus Percent composition of holoplankton ≥ 73 µm in San Francisco Bay, September, 1998 Indigenous Plankton Taxa Limnoithona tetraspina Oithona davisae Other Asian Calanoids Species of Non-indigenous copepods in San Francisco Bay Cyclopoida Limnoithona sinensis Limnoithona tetraspina Oithona davisae Calanoida Pseudodiaptomus forbesi Pseudodiaptomus marinus Sinocalanus doerri Acartiella sinensis Tortanus dextrilobatus Percent Numerical Composition of Holoplankton in the Lower Columbia River, June, 2003 Cyclopoida Cladocera Gray's River Gray's Bay Diaptomidae Eurytemora Pseudodiaptomus forbesi Skipanon River Sinocalanus doerri Young's River Longview Ditch Trojan Power Plant Woodland Dike Crane Lake Sturgeon Lake Clackamas River Rooster Rock Sand Island Sampling Ship’s Ballast in Puget Sound Non-indigenous Organisms that are known to be non-indigenous to the west coast of the Pacific Northwest. These can include holoplankton (spending entire life cycle in water column) and meroplankton (spending only larval stages in water column). www.2s.biglobe.ne.jp Oithona davisae Pseudodiaptomus forbesi Limnoithona tetraspina Coastal Organisms characteristic of bays and other nearshore habitats are assumed to be non-indigenous when the ballast source is not local. This consists mostly of larval meroplankton that usually can’t be identified to species. www.marlin.ac. uk Neomysis Barnacle nauplii www.microscopyuk.org.uk Bivalve larvae Crab zoea Oceanic/Unknown Organisms characteristic open ocean habitats, plus those that can occur in both coastal and oceanic waters, they consist mostly of holoplanktonic copepods. Calanus Tortanus Pseudocalanus Puget Sound Ship Sampling •Ship sampling started February 2001, and is continuing in Puget Sound and Columbia River ports •Replicated plankton sampling of 246 ships sampled through end of 2005 has been analyzed •Three vertical plankton hauls with 73 micrometer mesh net taken on each ship •Most holoplankton (copepods) identified to species, all taxa assigned as nonindigenous, coastal, oceanic, or unidentified affinity •UW and Washington Department of Fish and Wildlife are conducting a sampling and analysis program that will complement and expand on this work Source of Ballast Water: Region and Ship Type Region Bulk Carrier Container Tanker Articulated Tug/Barge Other Total Percent Japan 77 11 0 0 0 88 35.8 China 18 11 0 0 1 30 12.2 South Korea 13 4 0 0 1 18 7.3 California 5 5 32 16 6 61 24.8 British Columbia 2 7 0 0 0 9 3.7 Pacific Ocean 5 12 4 0 0 21 8.5 Other 4 5 3 4 0 19 7.7 Total 124 55 39 20 8 246 Percent 50 22.8 15.8 8.1 3.3 Exchange Locations from Ship’s Log Coordinates Overall Coastal/Nonindigenous Composition Coastal/non-indigenous organisms m-3 n+1 A 1000000 y = 0.328x - 10160.522 R2 = 0.000 100000 10000 1000 100 10 1 Percent Coastal/non-indigenous Organisms B 100 y = -0.0106x + 422.54 R2 = 0.026 90 80 70 60 50 40 30 20 10 0 2001-02 2003 2004 2005 Coastal/Nonindigenous Composition: Unexchanged vs. Exchanged Unexchanged Vessels Percent Density 100 1000000 90 Percent 70 10000 60 50 1000 40 100 30 20 Density, Numbers m-3 n+1 100000 80 10 10 0 1 Exchanged Vessels Percent 100 Density 1000000 90 Percent 70 100000 10000 60 50 1000 40 30 20 100 10 10 0 1 Density, Numbers m-3 n+1 80 Coastal/Nonindigenous Composition: Major Ship Types Bulk Carriers Percent Tankers Density + 1 100 Percent 1.00E+05 100 90 50 40 1.00E+02 30 20 70 1.00E+04 60 Percent 1.00E+03 Density, Numbers m-3 60 1.00E+05 80 50 1.00E+03 40 1.00E+02 30 1.00E+01 20 10 Density, Numbers m-3 1.00E+04 70 1.00E+01 10 0 1.00E+00 0 Container Vessels Percent 100 Articulated Tug/Barge Density+ 1 Percent 1.0E+05 90 1.0E+03 50 40 1.0E+02 30 20 1.00E+05 60 1.00E+04 50 1.00E+03 40 1.00E+02 30 1.00E+01 20 1.00E+00 10 1.00E-01 0 1.00E-02 1.0E+01 10 0 Percent 70 60 Density + 1 70 1.0E+04 Density, Numbers m-3 80 1.00E+00 1.0E+00 Density, Numbers m-3 Percent 1.00E+06 90 80 Percent Density + 1 Average Percent Composition and Densities of Coastal/non-indigenous Taxa by Ship Type Ship Type Mean Percent Standard Deviation Mean Density, m-3 Standard Deviation Bulk Carrier (123) 17.9 26.1 1034.5 3525.7 Container (57) 25.6 31.0 1141.0 5667.2 Tanker (39) 13.0 19.3 6783.3 25620.4 Articulated Tug/Barge (20) 18.4 18.9 4999.5 11973.0 General Cargo (7) 25.6 27.3 3718.8 9277.9 Average Percent Composition and Densities of Nonindigenous and Coastal Organisms by Source Non-indigenous Mean Percent Mean Density, m-3 Coastal Source Region Number Sampled Mean Percent Mean Density, m-3 Columbia River 4 21.8 1182.7 12.1 558.9 British Columbia 3 10.6 1513.2 8.6 1162.5 California 58 9.8 4304.7 6.8 1992.3 Pacific Ocean 20 5.8 1323.6 14.6 435.8 Japan 85 7.5 609.9 15.0 741.5 South Korea 18 0.3 3.2 10.9 134.6 China 29 0.4 32.0 12.5 370.1 Unknown 17 0.0 0.0 25.5 158.9 Statistics Results—ANOVA and Non-parametric Tests •Vessel Category/Exchange Method, Interaction: Exchange method was marginally significant (ER <FT and <no exchange) (p = 0.05) for nonindigenous percent and coastal and nonindigenous percent—no interactions found •Exchanged ships have lower percentages of non-indigenous and coastal/non-indigenous taxa than non-exchanged ships •Vessel Category: Articulated Tug/Barge and Tankers had higher densities and percents than other vessel categories and the differences were usually highly significant (p < 0.01) •Ballast Source: California was significantly higher than other major regions in nonindigenous and coastal/nonindigenous densities and percents •Season: No effect of season (winter, spring, summer, fall) or before and after increased regulatory scrutiny •Exchange has more affect on domestic trips than on international trips, but only for percents Ships Sampled Multiple Times ATB Sea Reliance Percent Non-indigenous * Density-Non-indigenous SPB: San Pedro Bay SFB: San Francisco Bay CR: Columbia River PS: Puget Sound 40 Density-Total Zooplankton SFB 35 CR 90000 Percent 70000 * * CR 60000 CR 20 50000 40000 15 10 30000 SPB SPB 20000 * SPB 5 Density, Number m-3 80000 30 25 CR SPB 3/03/05 6/01/05 10000 0 0 10/08/04 1/28/05 1/28/05 9/02/05 10/05/05 10/05/05 1/10/06 ATB Ocean Reliance Percent Non-indigenous Density-Non-indigenous Density-Total Zooplankton SFB 45 40 35000 30000 SFB 25000 35 30 20000 25 15000 20 CR 15 10000 10 SPB 5 SPB * * SFB SFB 3/17/05 3/17/05 PS 5000 SPB CR 0 0 9/30/04 9/30/04 10/23/04 10/23/04 10/19/05 12/21/05 1/06/06 1/06/06 Density, Number m-3 50 Percent * Indicates no exchange 100000 * Conclusions •Both densities and percent composition of non-indigenous and coastal organisms in ships entering Puget Sound appear to be decreasing, but are highly variable •ATB’s and tankers on coastal routes may pose higher risk than ships on cross-ocean routes •California as ballast source appears to be particularly risky •Experiments have shown exchange to be very effective, but compliance measures are needed to increase “good” exchanges •There may be large differences in compliance among individual ships—exchange effectiveness still depends on individual captain/crew choice Continuing Sampling •Ship sampling by WDFW is continuing; we are developing a sampling program incorporating both random and targeted sampling •Mesh size of net changing to take into account IMO standards (50 µm diagonal) •Continue following individual ships across time •Begin a digital photo library of non-indigenous and coastal organisms found in ship’s ballast •Expand Columbia River sampling Remaining Questions •What constitutes acceptable risk--do we know enough about it to “pass” or “fail” ship’s ballast based on zooplankton composition? •Measuring zooplankton in ballast can determine compliance if it is based on absolute numbers per unit area of target organisms, but not efficiency of exchange (unless before-andafter exchange samples are taken). •Are there any “indicator” taxa or discrete suite of taxa that can be reliably used to assess risk, or is a larger suite of organisms required? •Can determination of coastal and/or nonindigenous “risky” taxa be standardized and made reliable enough for routine application?
