Inferences for Biological Transport: Results from a West Coast Drift Card Study
advertisement
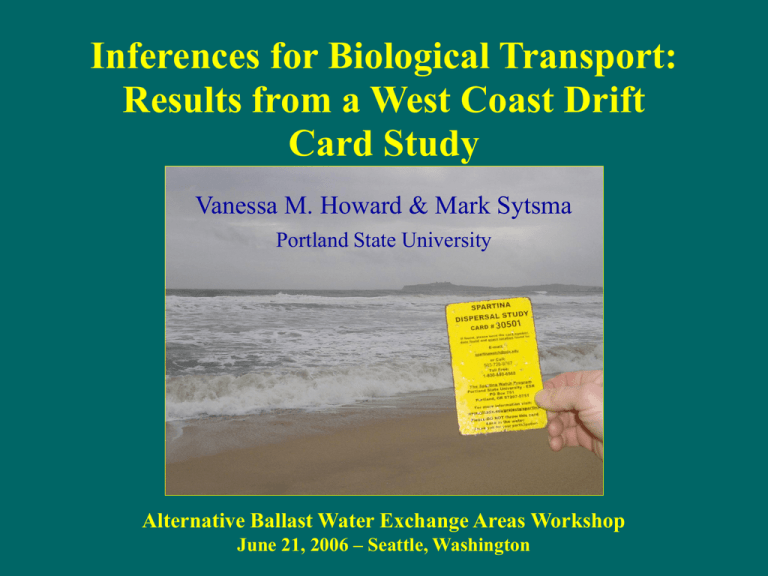
Inferences for Biological Transport: Results from a West Coast Drift Card Study Vanessa M. Howard & Mark Sytsma Portland State University Alternative Ballast Water Exchange Areas Workshop June 21, 2006 – Seattle, Washington Outline • Background • Methods • Results – Return rates & recovery time – Recovery patterns - spatial & seasonal • Summary Schwartzlose 1963 Background • Circulation patterns/currents www.noaanews.noaa.gov (Schwartzlose 1963, Heath 1969, Dewees & Strange 1984) • Situation of marine protected areas (Klinger & Ebbesmeyer 2001) • Sewage outfall (Crone et al 1998, Sauers et al 2001) • Floating materials – hypothetical oil spill (NOAA’s 2005 Safe Sancuary Drill in FL Keys NMS) – floating pollutants (NOAA’s 2002-04 Hawaii Drift Card Study) Objectives Photo courtesy of NRCS • Understand potential seasonal &/or spatial patterns of ocean dispersal from three heavily infested bays • Understand relative risk posed by various Spartina species • Identify common debris collection zones • Education & outreach Methods – Card Design • Buoyant plywood cards (10 cm x 15 cm) • Biodegradable - designed to persist 3-6 months • Coded for release date and location • NOAA specifications (Oahu, Hawaii Drift Card Study 2002-2004) Methods – Releases • Three release locations • September 2005 through August 2005 • 200 cards • Within two hours of high tide Willapa Bay Humboldt Bay San Francisco Willapa Humboldt San Fran Aug-05 Jul-05 70% Jun-05 80% May-05 Apr-05 Mar-05 Feb-05 Jan-05 Dec-04 Nov-04 Oct-04 Sep-04 # recovered/total released Results – return rates 100% 90% Willapa 41.8% 60% 50% 40% 30% 20% 10% 0% Willapa Humboldt San Fran Aug-05 Jul-05 Jun-05 70% May-05 80% Apr-05 Mar-05 Feb-05 Jan-05 Dec-04 Nov-04 Oct-04 Sep-04 # recovered/total released Results – return rates 100% 90% Humboldt 26.2% 60% 50% 40% 30% 20% 10% 0% Willapa Humboldt San Fran Aug-05 Jul-05 Jun-05 May-05 70% Apr-05 80% Mar-05 Feb-05 Jan-05 Dec-04 Nov-04 Oct-04 Sep-04 # recovered/total released Results – return rates 100% 90% San Francisco 43.8% 60% 50% 40% 30% 20% 10% 0% Recovery time 1.0 % of total recovery 0.8 0.6 0.4 San Francisco Humboldt Bay Willapa Bay 0.2 0.0 0 50 100 150 200 250 300 Days after release 350 400 450 500 Results – bay vs. coast # cards 1000 800 600 400 200 0 WB HB SF bay 78 7 288 ocean 925 622 763 Results – near vs. long distance 1.00 0.90 0.80 0.70 >100 km 50-100 km 25-50 km < 25 km 0.60 0.50 0.40 0.30 0.20 0.10 0.00 WB HB SF WB releases Max North ~ 2,000 km (129 days) Max South ~ 300 km (227 days) WB releases Seasonal Patterns Willapa: Estimated velocities mean (range) SOUTH (km/d) NORTH (km/d) Fall 4.13 (0.18-12.99) 2.75 (0.03-12.73) Winter --- 6.51 (0.08-36.86) Spring 2.58 (0.09-6.78) 2.11 (0.04-12.77) Summer 2.88 (0.23-7.80) 2.84 (0.08-12.75) HB releases Max North ~ 2,800 km (214 days) Max South ~ 530 km (45 days) HB releases Seasonal Patterns Humboldt: Estimated velocities mean (range) SOUTH (km/d) NORTH (km/d) Fall 0.48 (0.02-5.28) 1.59 (0.02-13.46) Winter 3.41 (0.02-11.15) 9.01 (0.02-24.52) Spring 1.29 (0.02-6.17) 3.54 (0.05-12.47) Summer 0.80 (0.02-4.91) 2.44 (0.04-10.49) SF releases Max North ~ 630 km (56 days) Max South ~ 400 km (151 days) SF releases Seasonal Patterns Known S. alterniflora x foliosa hybrid San Francisco: Estimated velocities mean (range) SOUTH NORTH Fall 1.41 (0.03-6.69) 2.02 (0.18-14.55) Winter 1.19 (0.05-5.37) 2.95 (0.08-16.06) Spring 1.45 (0.02-14.0) 2.61 (0.01-11.38) Summer 1.51 (0.09-16.06) 1.95 (0.11-3.04) Discussion Limitations: • Simulates surface transport only • Does not account for life history or behavior • May underestimate velocities • Does not account for inter-annual variation Applications: • • • • Knowledge of near-shore, coast-wise transport Emphasizes seasonal nature of dispersal Identifies likely collection zones Inexpensive - allowing greater numbers of replicates Summary • Drift from these three locations has a large seasonal component, generally following known patterns of ocean currents • Highest northward velocities & transport seen in WB & HB winter releases • Lower velocities & transport from SF • Local deposition more likely than distant, although rapid long-distance transport seen in certain instances • Question of transport into estuaries? • Additional releases of drift cards may help identify collection zones Acknowledgements Funding San Francisco Estuary Institute Oregon Department of Agriculture Washington Department of Fish & Wildlife Collaborators Kristen Ward, Golden Gate National Recreation Area (NPS) Travis Haring, Russell Nunez, Les Holcomb and David Heimer, WDFW Bill Pinnix, USDFW - Arcata office Volunteers Beachwatch (CA) COOAST (WA & OR) SOLV (OR) Beachcombers, tourists, children & many others Questions ? 700 Recoveries North of release site 600 Willapa Humboldt San Fran # of cards 500 400 300 200 100 0 < 25 25-50 50-100 distance (km) >100 300 Recoveries South of release site 250 Willapa Humboldt San Fran # of cards 200 150 100 50 0 < 25 25-50 50-100 distance (km) >100
