Endogenous_Models_of_the_Economic_Cycle.doc
advertisement

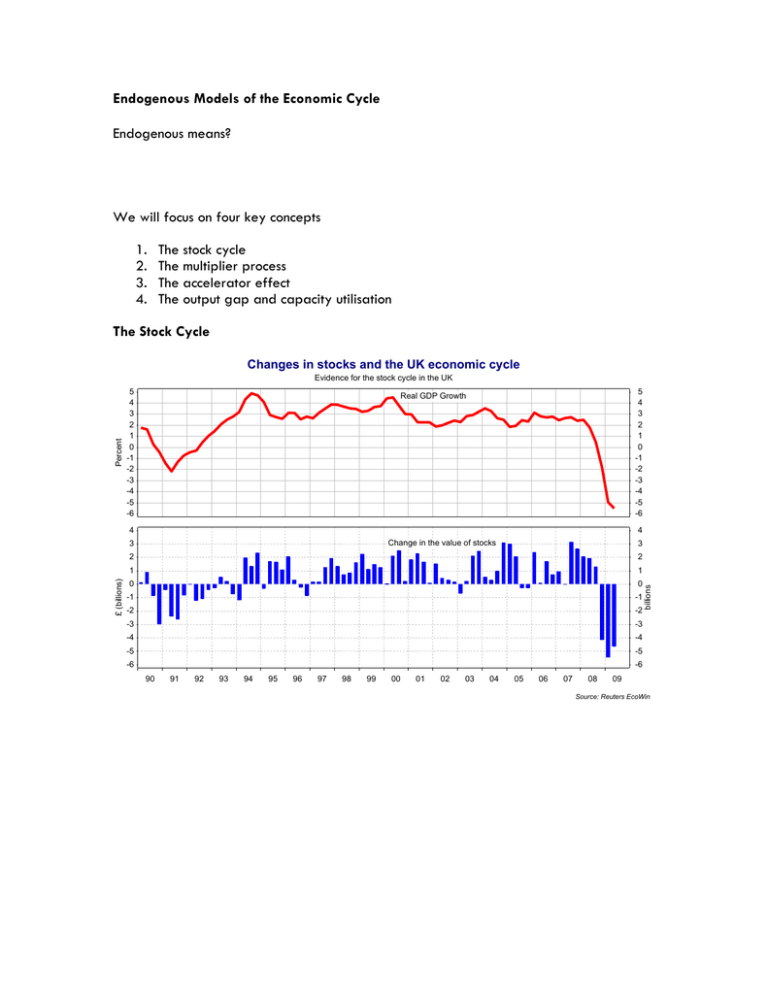
Endogenous Models of the Economic Cycle Endogenous means? We will focus on four key concepts 1. 2. 3. 4. The stock cycle The multiplier process The accelerator effect The output gap and capacity utilisation The Stock Cycle Changes in stocks and the UK economic cycle 5 4 3 2 1 0 -1 -2 -3 -4 -5 -6 Real GDP Growth 4 4 Change in the value of stocks £ (billions) 3 3 2 2 1 1 0 0 -1 -1 -2 -2 -3 -3 -4 -4 -5 -5 -6 billions Percent Evidence for the stock cycle in the UK 5 4 3 2 1 0 -1 -2 -3 -4 -5 -6 -6 90 91 92 93 94 95 96 97 98 99 00 01 02 03 04 05 06 07 08 09 Source: Reuters EcoWin The multiplier process What does the multiplier process mean? Example: Cyclical fluctuations in car manufacturing United Kingdom Passenger Car Production Number of Monthly output figures, non-seasonally adjusted 130000 130000 120000 120000 110000 110000 100000 100000 90000 90000 80000 80000 70000 70000 60000 60000 50000 50000 40000 40000 30000 30000 20000 20000 10000 10000 0 0 01 02 03 Passenger cars, for home market 04 05 06 07 08 09 Passenger cars, for export Source: Society of Motor Manufacturers and Traders The Accelerator Effect Economic Growth and Capital Investment Annual % change in real GDP and real investment, 2009-10 forecast from OECD 20 15 15 10 10 5 5 0 0 -5 -5 -10 -10 Percent 20 -15 -15 88 89 90 91 92 93 94 95 96 97 98 99 00 01 02 03 04 United Kingdom, Real GDP, precentage change from previous period, Constant Prices 05 06 07 08 09 Capital Investment Spending Source: Reuters EcoWin Percentage of industrial firms working below capacity Per cent of firms below capacity CBI Industrial Trends Survey, quarterly data 80 80 75 75 70 70 65 65 60 60 55 55 50 50 45 45 40 40 35 35 30 30 86 87 88 89 90 91 92 93 94 95 96 97 98 99 00 01 02 03 04 05 06 07 08 09 Source: CBI Manufacturing Survey The Output Gap 1.3 1.2 1.2 1.1 1.1 1.0 1.0 0.9 0.9 0.8 0.8 0.7 0.7 0.6 0.6 5 4 3 2 1 0 -1 -2 -3 -4 -5 -6 -7 5 thousand billions 1.3 Percentage of potential GDP at constant prices (thousand billions) UK Real GDP and Output Gap Output Gap measured as a % of potential GDP source: OECD 4 3 2 1 0 -1 -2 -3 -4 -5 -6 -7 82 80 86 84 90 88 94 92 98 96 04 02 00 08 06 10 Source: Reuters EcoWin The Output Gap and Unemployment in the UK Output Gap, Unemployment - claimant count measure 10.0 10.0 Unemployment 7.5 7.5 5.0 5.0 Per cent Output gap 2.5 2.5 0.0 0.0 -2.5 -2.5 -5.0 -5.0 -7.5 -7.5 88 89 90 91 92 93 94 95 96 97 98 99 00 01 02 03 04 05 06 07 08 09 10 Source: Reuters EcoWin


