Rg of Sphere
advertisement

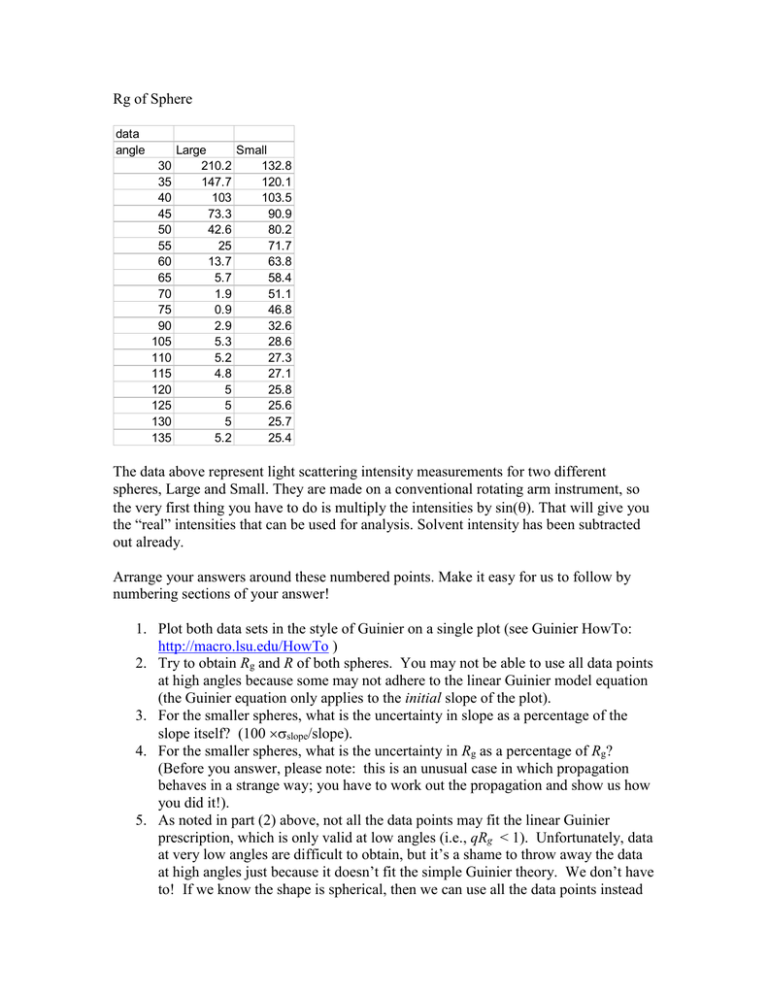
Rg of Sphere data angle 30 35 40 45 50 55 60 65 70 75 90 105 110 115 120 125 130 135 Large Small 210.2 132.8 147.7 120.1 103 103.5 73.3 90.9 42.6 80.2 25 71.7 13.7 63.8 5.7 58.4 1.9 51.1 0.9 46.8 2.9 32.6 5.3 28.6 5.2 27.3 4.8 27.1 5 25.8 5 25.6 5 25.7 5.2 25.4 The data above represent light scattering intensity measurements for two different spheres, Large and Small. They are made on a conventional rotating arm instrument, so the very first thing you have to do is multiply the intensities by sin(). That will give you the “real” intensities that can be used for analysis. Solvent intensity has been subtracted out already. Arrange your answers around these numbered points. Make it easy for us to follow by numbering sections of your answer! 1. Plot both data sets in the style of Guinier on a single plot (see Guinier HowTo: http://macro.lsu.edu/HowTo ) 2. Try to obtain Rg and R of both spheres. You may not be able to use all data points at high angles because some may not adhere to the linear Guinier model equation (the Guinier equation only applies to the initial slope of the plot). 3. For the smaller spheres, what is the uncertainty in slope as a percentage of the slope itself? (100 slope/slope). 4. For the smaller spheres, what is the uncertainty in Rg as a percentage of Rg? (Before you answer, please note: this is an unusual case in which propagation behaves in a strange way; you have to work out the propagation and show us how you did it!). 5. As noted in part (2) above, not all the data points may fit the linear Guinier prescription, which is only valid at low angles (i.e., qRg < 1). Unfortunately, data at very low angles are difficult to obtain, but it’s a shame to throw away the data at high angles just because it doesn’t fit the simple Guinier theory. We don’t have to! If we know the shape is spherical, then we can use all the data points instead of throwing away ones the high angles. Do this by using Solver (or other nonlinear least squares fitting package) to fit the data (after correcting for scattering volume) to the particle form factor equation for spheres: 2 3 I (q) I (0) 3 (sin x x cos x) x where x = qR (not Rg) and I(0) is the intensity at zero scattering angle. You will set up a solver to fit I(0) and R. You should also add a smooth curve showing the fitted equation (of course, you need the solver-found values at the discrete points, too). From the fit, you should be able to obtain better values of R (and then Rg,). At least they should be better for the large sphere. Compare the Guinier and solver values and make it easy for us to find that! Here is your chance to practice what we learned about nonlinear least squares fitting a few weeks ago! Grading Criteria Plot /4 Rg and R of both /6 Slope uncertainty /4 Propagate /6 Solver /10


