How Did Income and Opportunity and Ownership Facts An Urban Institute Project Exploring
advertisement

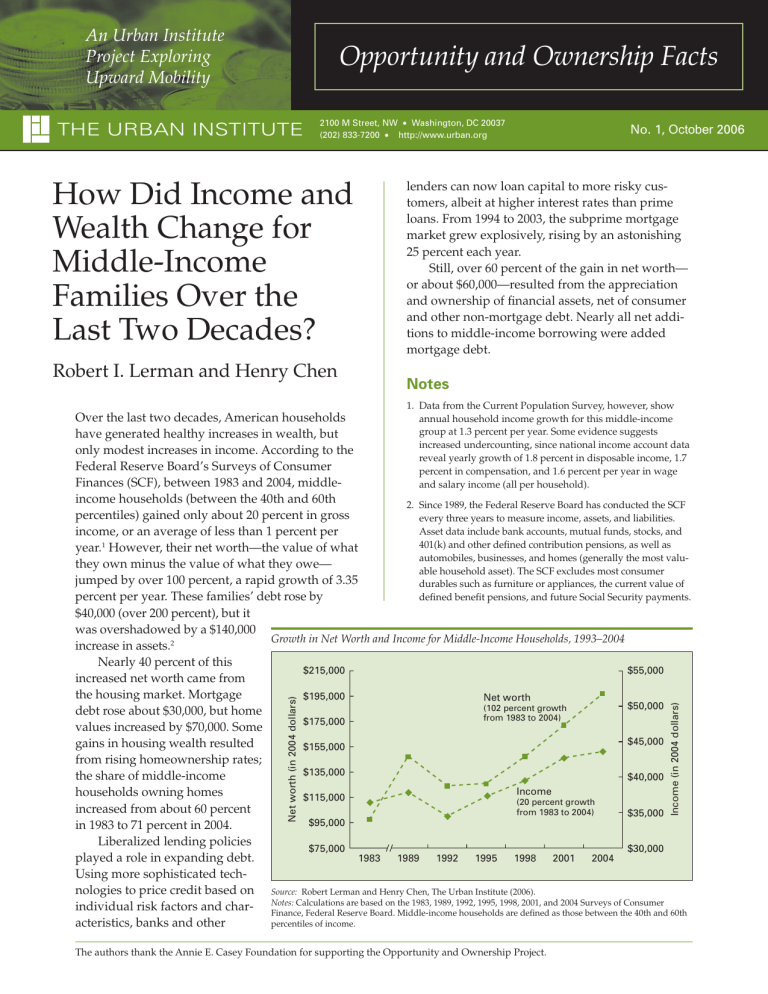
An Urban Institute Project Exploring Upward Mobility Opportunity and Ownership Facts THE URBAN INSTITUTE 2100 M Street, NW • Washington, DC 20037 (202) 833-7200 • http://www.urban.org How Did Income and Wealth Change for Middle-Income Families Over the Last Two Decades? Robert I. Lerman and Henry Chen No. 1, October 2006 lenders can now loan capital to more risky customers, albeit at higher interest rates than prime loans. From 1994 to 2003, the subprime mortgage market grew explosively, rising by an astonishing 25 percent each year. Still, over 60 percent of the gain in net worth— or about $60,000—resulted from the appreciation and ownership of financial assets, net of consumer and other non-mortgage debt. Nearly all net additions to middle-income borrowing were added mortgage debt. Notes 1. Data from the Current Population Survey, however, show The authors thank the Annie E. Casey Foundation for supporting the Opportunity and Ownership Project. Income (in 2004 dollars) Net worth (in 2004 dollars) Over the last two decades, American households annual household income growth for this middle-income group at 1.3 percent per year. Some evidence suggests have generated healthy increases in wealth, but increased undercounting, since national income account data only modest increases in income. According to the reveal yearly growth of 1.8 percent in disposable income, 1.7 Federal Reserve Board’s Surveys of Consumer percent in compensation, and 1.6 percent per year in wage Finances (SCF), between 1983 and 2004, middleand salary income (all per household). income households (between the 40th and 60th 2. Since 1989, the Federal Reserve Board has conducted the SCF percentiles) gained only about 20 percent in gross every three years to measure income, assets, and liabilities. Asset data include bank accounts, mutual funds, stocks, and income, or an average of less than 1 percent per 1 401(k) and other defined contribution pensions, as well as year. However, their net worth—the value of what automobiles, businesses, and homes (generally the most valuthey own minus the value of what they owe— able household asset). The SCF excludes most consumer jumped by over 100 percent, a rapid growth of 3.35 durables such as furniture or appliances, the current value of defined benefit pensions, and future Social Security payments. percent per year. These families’ debt rose by $40,000 (over 200 percent), but it was overshadowed by a $140,000 Growth in Net Worth and Income for Middle-Income Households, 1993–2004 increase in assets.2 Nearly 40 percent of this $55,000 $215,000 increased net worth came from the housing market. Mortgage $195,000 Net worth $50,000 (102 percent growth debt rose about $30,000, but home from 1983 to 2004) $175,000 values increased by $70,000. Some $45,000 gains in housing wealth resulted $155,000 from rising homeownership rates; $135,000 the share of middle-income $40,000 Income households owning homes $115,000 (20 percent growth increased from about 60 percent from 1983 to 2004) $35,000 $95,000 in 1983 to 71 percent in 2004. Liberalized lending policies $75,000 $30,000 played a role in expanding debt. 1983 1989 1992 1995 1998 2001 2004 Using more sophisticated technologies to price credit based on Source: Robert Lerman and Henry Chen, The Urban Institute (2006). Calculations are based on the 1983, 1989, 1992, 1995, 1998, 2001, and 2004 Surveys of Consumer individual risk factors and char- Notes: Finance, Federal Reserve Board. Middle-income households are defined as those between the 40th and 60th percentiles of income. acteristics, banks and other


