Traffic Impact Assessment Table of Contents
advertisement
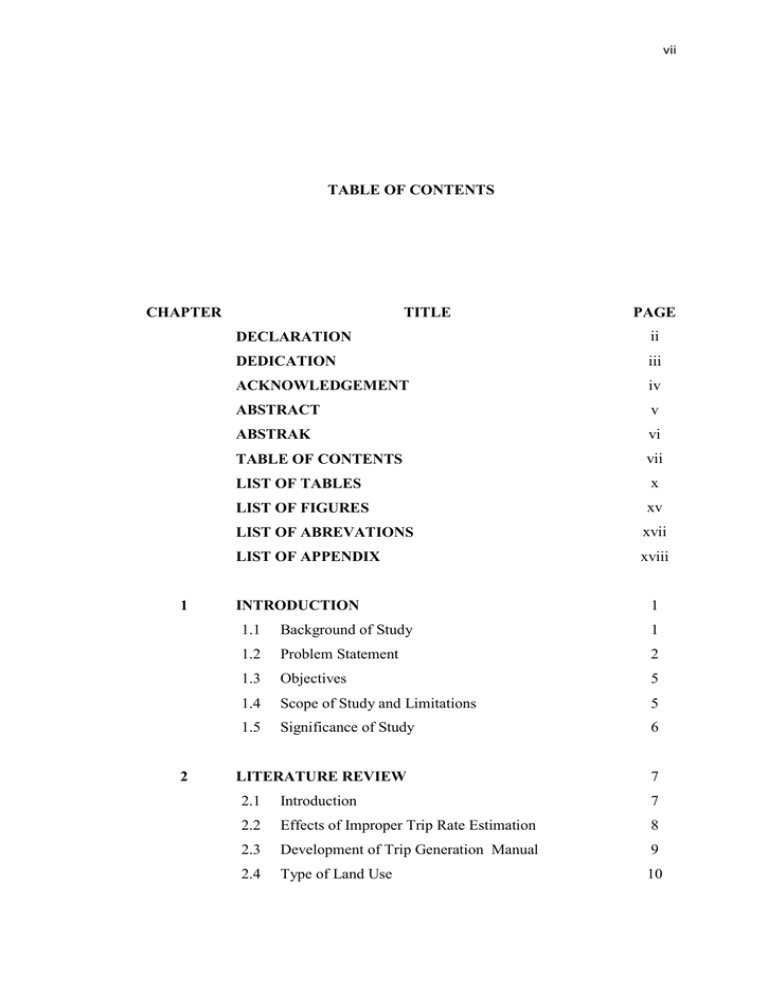
vii TABLE OF CONTENTS CHAPTER 1 2 TITLE PAGE DECLARATION ii DEDICATION iii ACKNOWLEDGEMENT iv ABSTRACT v ABSTRAK vi TABLE OF CONTENTS vii LIST OF TABLES x LIST OF FIGURES xv LIST OF ABREVATIONS xvii LIST OF APPENDIX xviii INTRODUCTION 1 1.1 Background of Study 1 1.2 Problem Statement 2 1.3 Objectives 5 1.4 Scope of Study and Limitations 5 1.5 Significance of Study 6 LITERATURE REVIEW 7 2.1 Introduction 7 2.2 Effects of Improper Trip Rate Estimation 8 2.3 Development of Trip Generation Manual 9 2.4 Type of Land Use 10 viii 2.5 Current Traffic Condition 14 2.5.1 Origin-Destination Survey 14 Forecasting Travel Demand 15 2.6.1 Sequential Steps of Travel Forecasting 16 2.6.2 Trip Generation 18 2.6.3 Types of Trips 18 2.6.4 Determination of Mean Trip Rates 21 2.7 Traffic Growth Factor 24 2.8 Transport Improvement 24 2.6 3 26 RESEARCH METHODOLOGY 3.1 Introduction 26 3.2 Collection of Data 29 3.3 Study Boundary 29 3.4 Current and Proposed Land Use Developments 31 3.5 Type, Location and Characteristics of Proposed New 36 Commercial Development 3.6 Number and Locations of Existing Commercial 39 Developments with Similar Characteristics 3.7 3.8 Questionnaire Surveys 41 3.7.1 Customers Survey 41 3.7.2 Shop Owners Survey 43 Vehicle Counts 43 3.8.1 Vehicles Count at Existing Commercial 44 3.8.2 Vehicles Count at Critical Intersection near the 46 Developments Proposed Tesco 3.9 3.11 Mean Trip Rate Estimation Procedures 48 3.9.1 Trip Rate Analysis Procedures 48 3.9.2 Cross-Classification Analysis Procedures 50 3.9.3 Regression Analysis Procedures 51 3.10 52 Projected Traffic Volume Appropriate Road Improvement 54 ix 4 55 ANALYSIS AND RESULTS 4.1 Introduction 55 4.2 Trip Rate Analysis 56 4.2.1 Giant U Mall 56 4.2.2 Jusco Taman Universiti 56 4.2.3 Carrefour Sutera Utama 57 4.2.4 Mean Trip Rate Using Trip Rate Analysis 57 Cross-Classification Analysis 58 4.3.1 Giant U Mall 58 4.3.2 Jusco Taman Universiti 70 4.3.3 Carrefour Sutera Utama 82 4.3.4 Mean Trip Rate Using Cross-Classification 98 4.3 Analysis 4.4 4.5 Regression Analysis 99 4.4.1 Mean Trip Rate Using Regression Analysis 105 Comparison of Entry Mean Trip Rate Using Trip Rate 106 Analysis, Cross-Classification Analysis, Regression Analysis and Trip Generation Manual 4.6 Traffic Impact Assessment 4.6.1 Base Year Traffic 107 Volume at Critical 107 4.6.2 Projected Traffic Volume at Opening Year 110 Intersection 2015 4.6.3 Projected Traffic Volume in Horizon Year 112 2025 4.7 5 Transport Improvement CONCLUSIONS 5.1 Conclusions 114 115 115 REFERENCES 119 APPENDIX A-C 121 x LIST OF TABLES TABLE NO TITLE PAGE 2.1 Effects of improper estimation of trip rates (Minhans, A. 8 et. al., 2012) 2.2 Typical trip production table (Garber and Hoel, 2009) 22 2.3 Typical trip attractions table (Garber and Hoel, 2009) 23 3.1 Districts within each zone together with population size 31 3.2 Percentage of each type of land use in Skudai Town as 33 obtained from MPJBT 3.3 General characteristics of the proposed TH, GUM, JTU 40 and CSU 3.4 PCU factors as taken from Malaysian Trip Generation 49 Manual 2010 by HPU 4.1 Trip Rate Analysis results (GUM) 56 4.2 Trip Rate Analysis results (JTU) 56 4.3 Trip Rate Analysis results (CSU) 57 4.4 Weekday AM peak, weekday PM peak, weekend AM 58 peak and weekend PM peak mean trip rate PCU trips per hour per 100m2 GFA and standard deviation 4.5 Weekday AM peak survey data (GUM) 59 4.6 No. of shops in each GFA category versus no. of 59 employees 4.7 Average number of person trips per shop per hour 60 versus GFA and number of employees 4.8 Percentage of shops in each GFA category 60 xi 4.9 Number of person trips per hour with respect to each 60 GFA category and number of employees 4.10 Weekday PM peak survey data (GUM) 62 4.11 No. of shops in each GFA category versus no. of 62 employees 4.12 Average number of person trips per shop per hour 63 versus GFA and number of employees 4.13 Percentage of shops in each GFA category 63 4.14 Number of person trips per hour with respect to each 63 GFA category and number of employees 4.15 Weekend AM peak survey data (GUM) 65 4.16 No. of shops in each GFA category versus no. of 65 employees 4.17 Average number of person trips per shop per hour 66 versus GFA and number of employees 4.18 Percentage of shops in each GFA category 66 4.19 Number of person trips per hour with respect to each 66 GFA category and number of employees 4.20 Weekend PM peak survey data (GUM) 68 4.21 No. of shops in each GFA category versus no. of 68 employees 4.22 Average number of person trips per shop per hour 69 versus GFA and number of employees 4.23 Percentage of shops in each GFA category 69 4.24 Number of person trips per hour with respect to each 69 GFA category and number of employees 4.25 Weekday AM peak survey data (JTU) 71 4.26 No. of shops in each GFA category versus employees 71 4.27 Average number of person trips per shop per hour 72 versus GFA and number of employees 4.28 Percentage of shops in each GFA category 72 4.29 Number of person trips per hour with respect to each 72 GFA category and number of employees xii 4.30 Weekday PM peak survey data (JTU) 74 4.31 No. of shops in each GFA category versus no. of 74 employees 4.32 Average number of person trips per shop per hour 75 versus GFA and number of employees 4.33 Percentage of shops in each GFA category 75 4.34 Number of person trips per hour with respect to each 75 GFA category and number of employees 4.35 Weekend AM peak survey data (JTU) 77 4.36 No. of shops in each GFA category versus no. of 77 employees 4.37 Average number of person trips per shop per hour 78 versus GFA and number of employees 4.38 Percentage of shops in each GFA category 78 4.39 Number of person trips per hour with respect to each 78 GFA category and number of employees 4.40 Weekend PM peak survey data (JTU) 80 4.41 No. of shops in each GFA category versus no. of 80 employees 4.42 Average number of person trips per shop per hour 81 versus GFA and number of employees 4.43 Percentage of shops in each GFA category 81 4.44 Number of person trips per hour with respect to each 81 GFA category and number of employees 4.45 Weekday AM peak survey data (CSU) 83 4.46 No. of shops in each GFA category versus no. of 84 employees 4.47 Average number of person trips per shop per hour 84 versus GFA and number of employees 4.48 Percentage of shops in each GFA category 84 4.49 Number of person trips per hour with respect to each 85 GFA category and number of employees 4.50 Weekday PM peak survey data (CSU) 87 xiii 4.51 No. of shops in each GFA category versus no. of 88 employees 4.52 Average number of person trips per shop per hour 88 versus GFA and number of employees 4.53 Percentage of shops in each GFA category 88 4.54 Number of person trips per hour with respect to each 89 GFA category and number of employees 4.55 Weekend AM peak survey data (CSU) 91 4.56 No. of shops in each GFA category versus no. of 92 employees 4.57 Average number of person trips per shop per hour 92 versus GFA and number of employees 4.58 Percentage of shops in each GFA category 92 4.59 Number of person trips per hour with respect to each 93 GFA category and number of employees 4.60 Weekend PM peak survey data (CSU) 95 4.61 No. of shops in each GFA category versus no. of 96 employees 4.62 Average number of person trips per shop per hour 96 versus GFA and number of employees 4.63 Percentage of shops in each GFA category 96 4.64 Number of person trips per hour with respect to each 97 GFA category and number of employees 4.65 Weekday AM peak, weekday PM peak, weekend AM 98 peak and weekend PM peak mean trip rate PCU trips per hour per 100m2 GFA and standard deviation using Cross-Classification Analysis 4.66 Dependency between GFA and number of employees to 99 number of trips 4.67 Dependency of GFA to number of trips 99 4.68 Dependency of number of employees to number of trips 100 4.69 Mean trip rate from regression Analysis for GUM 102 4.70 Mean trip rate from regression Analysis for JTU 103 xiv 4.71 Mean trip rate from regression Analysis for CSU 105 4.72 Weekday AM peak, weekday PM peak, weekend AM 106 peak and weekend PM peak mean trip rate PCU trips per hour per 100m2 GFA and standard deviation using Regression Analysis 4.73 Comparison of entry mean trip rate per 100 m 2 GFA using trip analysis, cross-classification 107 analysis, regression analysis and Trip Generation Manual 4.74 Base year intersection performance 110 4.75 Number of trips generated by the proposed TH 111 4.76 Intersection performance at opening year 2015 112 4.77 Projected intersection performance in horizon year 2025 113 with the proposed TH 4.78 Projected intersection performance in horizon year 2025 with the proposed TH and proposed road improvement 114 xv LIST OF FIGURES FIGURE NO TITLE PAGE 2.1 Type and intensity of land uses in Skudai Town (source: 12 MPJBT Johor Map 2010) 2.2 Travel forecasting process 17 2.3 Typical home based (HB) trip with respect to trip 19 production and trip attraction 2.4 Typical non-home (NHB) based trip with respect to trip 19 production and trip attraction 2.5 Trips characteristics (Minhans, A., 2008) 20 2.6 Transport improvement methods (Minhans, A., Pillai, 25 C. M., 2012) 3.1 Flowchart for the activity of the study 28 3.2 Study area boundary (not to scale) 30 3.3 Boundary of each zone within Skudai Town 30 3.4 Current and proposed all type of land use in Skudai 32 Town as obtained from MPJBT 3.5 Current and proposed commercial type of land use in 34 Skudai Town as obtained from MPJBT 3.6 Current commercial type of land use in Skudai Town as 35 obtained from MPJBT 3.7 Proposed (2020) commercial type of land use in Skudai 36 Town as obtained from MPJBT 3.8(a) Location of new proposed TH at Taman Sri Pulai Perdana (not to scale) 38 xvi 3.8(b) Location of new proposed TH at Taman Sri Pulai 38 Perdana (not to scale) 3.9 Location of proposed TH, GUM, JTU and CSU (not to 40 scale) 3.10 Surveyor locations for the manual vehicle counting for 44 GUM 3.11 Surveyor locations for the manual vehicle counting for 45 JTU 3.12 Surveyor locations for the manual vehicle counting for 45 CSU 3.13 Location of critical intersection nearby the proposed TH 47 3.14 Geometry layout of the intersection 47 4.1 Weekday AM peak (GUM) 100 4.2 Weekday PM peak (GUM) 101 4.3 Weekend AM peak (GUM) 101 4.4 Weekend PM peak (GUM) 101 4.5 Weekday AM peak (JTU) 102 4.6 Weekday PM peak (JTU) 102 4.7 Weekend AM peak (JTU) 103 4.8 Weekend PM peak (JTU) 103 4.9 Weekday AM peak (CSU) 104 4.10 Weekday PM peak (CSU) 104 4.11 Weekend AM peak (CSU) 104 4.12 Weekend PM peak (CSU) 105 4.13 Base year (2012) weekday AM peak hour traffic volume 108 4.14 Base year (2012) weekday PM peak hour traffic volume 108 4.15 Base year (2012) weekend AM peak hour traffic volume 109 4.16 Base year (2012) weekend PM peak hour traffic volume 109 4.17 Projected traffic volume at opening year 2015 without 111 the proposed TH in PCU/hr for all traffic movements 4.18 Projected traffic volume in horizon year 2025 with the proposed TH in PCU/hr for all traffic movements 113 xvii LIST OF ABBREVIATIONS Symbol Descriptions LOS Level of Service TIA Traffic Impact Assessment GFA Gross Floor Area HCM Highway Capacity Manual HPU Highway Planning Unit Malaysia ITE Institute Transportation Engineers O-D Origin-Destination IDR Iskandar Development Region TAZ Traffic Analysis Zone HB Home Based NHB TH GUM Non-Home Based Tesco Hypermarket Giant U Mall JTU Jusco Taman Universiti CSU Carrefour Sutera Utama xviii LIST OF APPENDIX APPENDIX TITLE PAGE Appendix A Customers Survey Form 121 Appendix B Shop Owners Survey Form 125 Appendix C Manual Vehicle Count Sheet 126
