vii CONTENT CHAPTER
advertisement
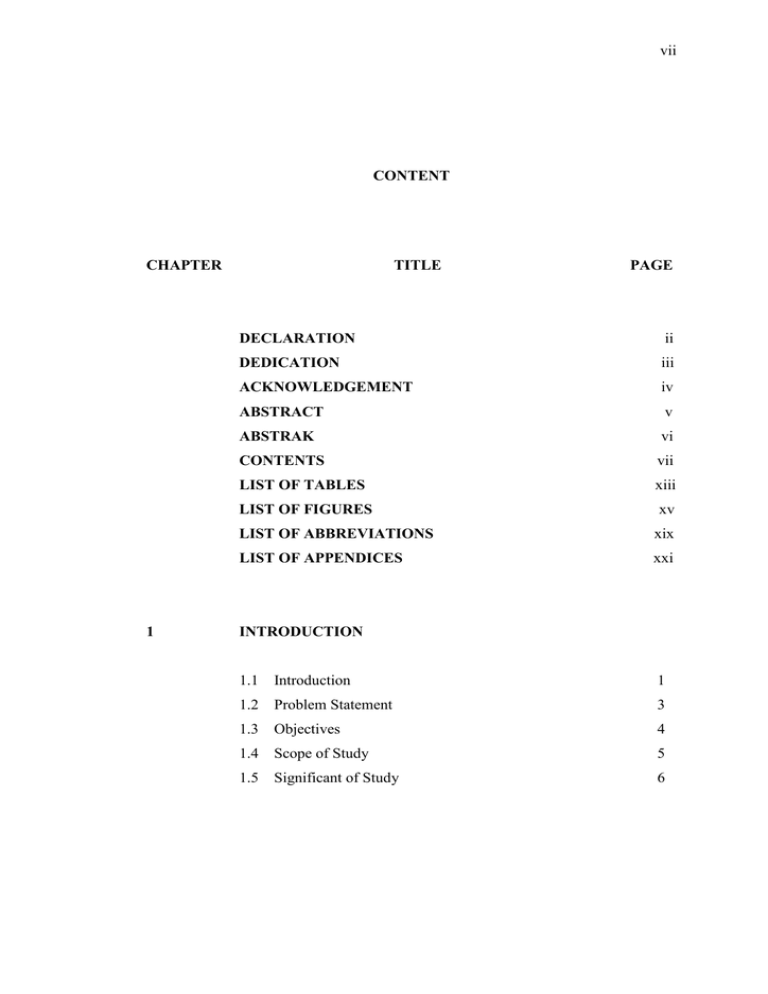
vii CONTENT CHAPTER 1 TITLE PAGE DECLARATION ii DEDICATION iii ACKNOWLEDGEMENT iv ABSTRACT v ABSTRAK vi CONTENTS vii LIST OF TABLES xiii LIST OF FIGURES xv LIST OF ABBREVIATIONS xix LIST OF APPENDICES xxi INTRODUCTION 1.1 Introduction 1 1.2 Problem Statement 3 1.3 Objectives 4 1.4 Scope of Study 5 1.5 Significant of Study 6 viii 2 LITERATURE REVIEW 2.1 Introduction 7 2.2 Danga – Pendas Coastal Area 7 2.2.1 9 Water Quality at Danga- Pendas Coastal Area 2.2.2 The Distribution of P.viridis 10 at Danga-Pendas coastal area 2.2.3 Existing and Future Planning Landuse 12 2.3 Iskandar Development Region (IDR) 13 2.4 Landuse Impact to Water Quality 16 2.5 Water Quality Parameters and Heavy Metals 17 2.5.1 Dissolved Oxygen (DO) 17 2.5.2 Temperature 18 2.5.3 pH 19 2.5.4 Salinity 20 2.5.5 Total Dissolved Solid (TDS) 20 2.5.6 Biochemical Oxygen Demand (BOD) 21 2.5.7 Chemical Oxygen Demand (COD) 21 2.5.8 Nutrients 22 2.5.8.1 Ammoniacal nitrogen 22 Heavy Metals 23 2.5.9.1 Nickel (Ni) 23 2.5.9.2 Zinc (Zn) 24 2.5.9.3 Lead (Pb) 24 2.5.9.4 Cadmium (Cd) 25 2.5.9 2.6 Water Quality Standard 25 2.6.1 26 Interim National Water Quality Standard (INWQS) 2.6.2 Interim National Marine Water Quality 26 Standard (INMWQS) 2.6.3 2.7 Water Quality Index (WQI) 27 Asian Green Mussel, Perna viridis 28 2.7.1 31 P.viridis as Bioindicator and ix Biomonitor 2.7.2 Heavy Metal Contamination on Green 32 Mussels (Perna viridis) 2.7.3 Studies of Heavy Metal Contaminants in 33 Green Mussels at Johor Rivers and Estuaries 2.8 Remote Sensing and Geographic Information 34 System (GIS) 2.8.1 Remote Sensing 34 2.8.1.1 Remote Sensing Data Landsat 39 Thematic Mapper (TM) and Enhanced Thematic Mapper (ETM) 2.8.2 2.9 3 Geographic Information System (GIS) 41 Integration of Remote Sensing and GIS 42 2.9.1 Landuse Monitoring Using Satellite Data 43 2.9.2 Landuse Change Detection 44 METHODOLOGY 3.1 Introduction 45 3.2 Literature Review 45 3.3 Data Collection and Sampling 46 3.4 Sampling Processes and Laboratory Analysis 46 3.4.1 Study Area and Sampling Stations 47 3.4.2 Sampling Frequency and Parameters 50 Analyzed 3.4.3 Sampling Techniques 51 3.4.4 Laboratory Analysis 52 3.4.4.1 Sample Pretreatment 52 3.4.4.2 Laboratory Analysis for BOD, 53 COD and Ammoniacal Nitrogen 3.4.4.3 Laboratory Analysis for Heavy Metals 3.5 54 Integrated Remote Sensing and GIS 55 3.5.1 55 Remote Sensing Data, Landsat TM x 3.5.2 4 Landuse Extraction from Satellite Imagery 57 3.5.2.1 Geometric Correction 58 3.5.2.2 Atmospheric Correction and Masking 59 3.5.2.3 Subset 60 3.5.2.4 Image Classification 60 3.5.3 Landuse Change Detection 61 3.7 Flowchart of Methodology 63 EFFECT OF LANDUSE ON WATER QUALITY 4.1 Introduction 64 4.2 Landuse Classification 64 4.2.1 Landuse Classification for 1991 65 4.2.2 Landuse Classification for 2000 66 4.2.3 Landuse Classification for 2005 67 4.2.4 Landuse Classification for 2008 68 4.3 Landuse Change Detection 69 4.3.1 Differential in 1991 and 2008 images 70 4.3.2 Statistical Difference 74 4.3.2.1 Statistical Changes Report for 75 1991 and 2005 4.3.2.2 Statistical Changes Report for 76 2005 and 2008 4.4 Analysis of Water Quality 77 4.4.1 77 Physical and Chemical Water Quality Parameters 4.4.1.1 Dissolved Oxygen (DO) 78 4.4.1.2 Temperature 79 4.4.1.3 Salinity 79 4.4.1.4 pH 81 4.4.1.5 Total Dissolved Solids (TDS) 82 4.4.1.6 Ammoniacal Nitrogen 82 4.4.1.7 Biochemical Oxygen Demand (BOD) 83 xi 4.4.2 4.5 4.4.1.8 Chemical Oxygen Demand (COD) 85 Heavy Metals 86 4.4.2.1 Zinc (Zn) 86 4.4.2.2 Lead (Pb) 88 4.4.2.3 Cadmium (Cd) 89 4.4.2.4 Nickel (Ni) 90 Analysis of Previous Water Quality Data Compared 92 to Present Data 4.6 Analysis on the Effects of Landuse Change to 99 Water Quality along Danga-Pendas coastal area 5 EFFECT OF WATER QUALITY ON GREEN MUSSELS (Perna viridis) 5.1 Introduction 102 5.2 Analysis on Effects of Water Quality on Green 102 Mussels Vs Water Samples 5.2.1 5.2.2 5.3 Physical Parameters 103 5.2.1.1 Dissolved Oxygen (DO) 103 5.2.1.2 Salinity 104 5.2.1.3 Temperature 105 5.2.1.4 pH 107 5.2.1.5 Total Dissolved Solids (TDS) 108 5.5.1.6 Ammoniacal Nitrogen 109 5.5.1.7 Biochemical Oxygen Demand (BOD) 110 5.5.18 Chemical Oxygen Demand (COD) 111 Heavy Metals 111 5.2.2.1 Cadmium (Cd) 112 5.2.2.2 Lead (Pb) 114 5.2.2.3 Zinc (Zn) 115 Comparison of Cd, Pb and Zn Concentrations 117 in P.viridis from Previous Studies 5.4 Effects of Water Quality on Green Mussel 122 xii 6 CONCLUSIONS AND RECOMMENDATIONS 6.1 Conclusions 124 6.2 Recommendations 126 REFERENCES 128 Appendix A – D 145 - 162 xiii LIST OF TABLES TABLES NO. TITLE PAGE 2.1 Salinity represents the types of water. 20 2.2 INWQS Classification 26 2.3 DOE- INMWQS parameters and standard 27 2.4 Water Quality Index 28 2.5 Scientific classification of Perna viridis 28 2.6 Description of seven elements in remote sensing 36 Processes 2.7 Landsat satellite sensor characteristic and specification 39 2.8 Landsat’s band descriptions 40 3.1 Data collection and sampling 46 3.2 Coordinates of the eleven sampling stations at the study area 48 3.3 Date of sampling 51 3.4 Recommended condition for Flame Atomic Absorption 55 Spectrophotometer 3.5 Landsat TM Specifications 57 3.6 Projection specifications 59 3.7 Coordinates for image subset. 60 4.1 Overall statistical landuse for 1991, 2000, 2005 75 and 2008 4.2 Statistical changes based on landuse types between 76 2005 and 1991 4.3 Statistical changes based on landuse types between 77 2005 and 2008 4.4 Water quality data for year 1991, 2006 and 2009 5.1 Guidelines of maximum permissible limits of heavy 94 118 xiv metals (µg/g) in seafood from different countries 5.2 Mean concentration of Cd, Pb and Zn in P.viridis collected from Pantai Lido in present and previous studies. 119 xv LIST OF FIGURES FIGURE NO. 2.1 TITLE PAGE (a) Location of Danga-Pendas coastal area 8 (b) Developed Danga coastal area (c) Mangrove along Pendas coastal area (d) Development progress of IDR near coastal area of Nusajaya. 2.2 Figure shows the tributaries which empty into 9 Danga – Pendas coastal area. 2.3 (a) Green mussels harvested area from satellite view. 11 (b) and (c) show the harvested mussels along Danga-Pendas Area. 2.4 Existing landuse along Danga-Pendas coastal area 12 2.5 Existing landuse types along Danga-Pendas. 13 2.6 Proposed land use under IDR 14 2.7 Proposed for major development of coastal zone 15 under Iskandar Development Region 2.8 Development of IDR near Tebing Runtuh 16 2.9 Green Mussel 29 2.10 The geographical distribution of P.viridis worldwide 30 2.11 Seven elements in remote sensing processes consisting of 35 A is energy source or illumination, B is radiation and the atmosphere, C is interaction with the target, D is recording of energy by the sensor, E is transmission, reception and processing, F is interpretation and analysis and G is applications 2.12 Example of (a) spatial variations (b) spectral 38 xvi resolution and (c) temporal resolution in remote sensing data. 2.13 Data integration from different forms of input through GIS 42 3.1 Flowchart of sampling and laboratory works 47 3.2 Location of study area with eleven sampling stations 48 3.3 Sampling station S2 at Sungai Danga estuary 49 3.4 Sampling station M1 for mussels collection station near 49 Sungai Melayu estuaries 3.5 Sampling stations M3 for mussel’s collection 50 3.6 Sampling station M4 and S9 near Nusajaya area 50 3.7 (a) YSI-USA multiparameter probe (b) HACH DR 54 5000 Spectrophotometer for water quality analysis 3.8 Perkin Elmer model Analyst 400 Atomic Absorption 54 Spectrometer 3.9 Landsat TM and ETM images 56 3.10 Flowchart of Landuse Classification 58 3.11 Flowchart of Landuse Change Detection. 62 3.12 Overall flowchart of methodology 63 4.1 Landuse classification for 1991 66 4.2 Landuse classification for 2000 67 4.3 Landuse classification for 2005 68 4.4 Landuse classification for 2008 69 4.5 Series of landuse types at Johor Bahru city center 71 4.6 Series of landuse information at Sungai Danga and 72 Sungai Skudai estuaries. 4.7 Series of landuse information at Nusajaya. 73 4.8 Landuse information at Sungai Pendas coastal area. 74 4.9 DO concentration measured at station S1 to S11 from 78 November 2008 to April 2009. 4.10 Temperature level measured at station S1 to S11 from 79 November 2008 to April 2009. 4.11 Salinity measured at station S1 to S11 from November 80 2008 to April 2009. 4.12 pH measured at station S1 to S11 from November 2008 81 xvii to April 2009. 4.13 TDS concentration measured at station S1 to S11 from 82 November 2008 to April 2009. 4.14 Ammoniacal nitrogen concentration measured at station 83 S1 to S11 from November 2008 to April 2009. 4.15 BOD concentration measured at station S1 to S11 from 84 November 2008 to February 2009. 4.16 COD concentration measured at station S1 to S11 from 86 November 2008 to February 2009. 4.17 Zinc concentration measured at station S1 to S11 from 87 November 2008 to April 2009. 4.18 Lead concentration measured at station S1 to S11 from 89 November 2008 to April 2009. 4.19 Cadmium concentration measured at station S1 to S11 90 from November 2008 to April 2009. 4.20 Nickel concentration measured at station S1 to S11 from 91 November 2008 to April 2009. 4.21 Water quality data at Danga and Pendas area for year 1991, 96 2006 and 2009 (a) pH (b) temperature (c) DO and (d) ammoniacal nitrogen (AN). 4.22 Heavy metals concentration data at Danga and Pendas 98 area for year 1991, 2006 and 2009 (a) zinc (b) cadmium (c) lead and (d) nickel. 4.23 Concentration of manufacturing in and outer of 100 Johor Bahru. 5.1 DO concentration at mussel sampling stations, M1 to 104 M4 from November 2008 to April 2009. 5.2 Salinity level at mussel sampling stations, M1 to M4 from 105 November 2008 to April 2009. 5.3 Water temperature at mussel sampling stations, M1 to 106 M4 from November 2008 to April 2009. 5.4 pH at mussel sampling stations, M1 to M4 from November 107 2008 to April 2009. 5.5 TDS concentration at mussel sampling stations, M1 to 108 xviii M4 from November 2008 to April 2009. 5.6 Ammoniacal nitrogen concentration at mussel sampling 109 stations, M1 to M4 from November 2008 to April 2009. 5.7 BOD concentration at mussel sampling stations, M1 to M4 110 from November 2008 to February 2009. 5.8 COD concentration at mussel sampling stations, M1 to 111 M4 from November 2008 to April 2009. 5.9 Cadmium concentration in water and P.viridis samples at 113 mussel sampling stations, M1 to M4 from November 2008 to April 2009. 5.10 Lead concentration in water and P.viridis samples at mussel 114 sampling stations, M1 to M4 from November 2008 to April 2009 5.11 Zinc concentration in (a) water and (b) P.viridis samples 116 at mussel sampling stations, M1 to M4 from November 2008 to April 2009. 5.12 Cadmium concentration in P.viridis samples at Pantai Lido 120 from 1991 to 2009 5.13 Lead concentration in P.viridis samples at Pantai Lido 121 from 1991to 2009. 5.14 Zinc concentration in P.viridis samples at Pantai Lido from 1991to 2009. 121 xix LIST OF ABBREVIATIONS µg - micro gram AN - Ammoniacal nitrogen BOD - Biochemical Oxygen Demand Cd - Cadmium COD - Chemical Oxygen Demand DDDW - Double Distilled Deionised Water DEIA - Detail Environmental Impact Assessment DN - Digital Number DO - Dissolved Oxygen DOE - Department of Environment DOF - Department of Fisheries ETM - Enhanced Thematic Mapper g - gram GCP - Ground Control Point GIS - Geographic Information System GPS - Global Positioning System ha - Hectares IDR - Iskandar Development Region INMWQS - Interim Marine National Water Quality Standard INWQS - Interim National Water Quality Standard JUPEM - Jabatan Ukur dan Pemetaan Malaysia m - meter MACRES - Malaysia Center for Remote Sensing mg - milligram Mid-IR - Middle Infrared NA - Not Available NH3 - Ammonia xx Ni - Nickel NIMPIS - National Introduced Marine Pest Information System NIR - Near Infrared NO2 - Nitrite NO3 - Nitrate NST - New Straits Times P.viridis - Perna viridis Pb - Lead ppm - part per million ppt - part per thousand RADAR - Radio Detection and Ranging ROI - Region of Interest RSO - Rectified Skew Orthomorphic SEC - Special Economic Corridor SJER - South Johor Economic Region SPOT - Systeme pour l’Observation de la Terre TDS - Total Dissolved Solids TM - Thematic Mapper US EPA - United State Environmental Protection Agency USGS - United State Geological Survey WQ - Water quality WQI - Water Quality Index xxi LIST OF APPENDICES APPENDIX TITLE PAGE A Water Quality Standard 145 B Laboratory Analysis 147 C Accuracy Assessment for Landuse Classification 152 D Water Quality Data 154

