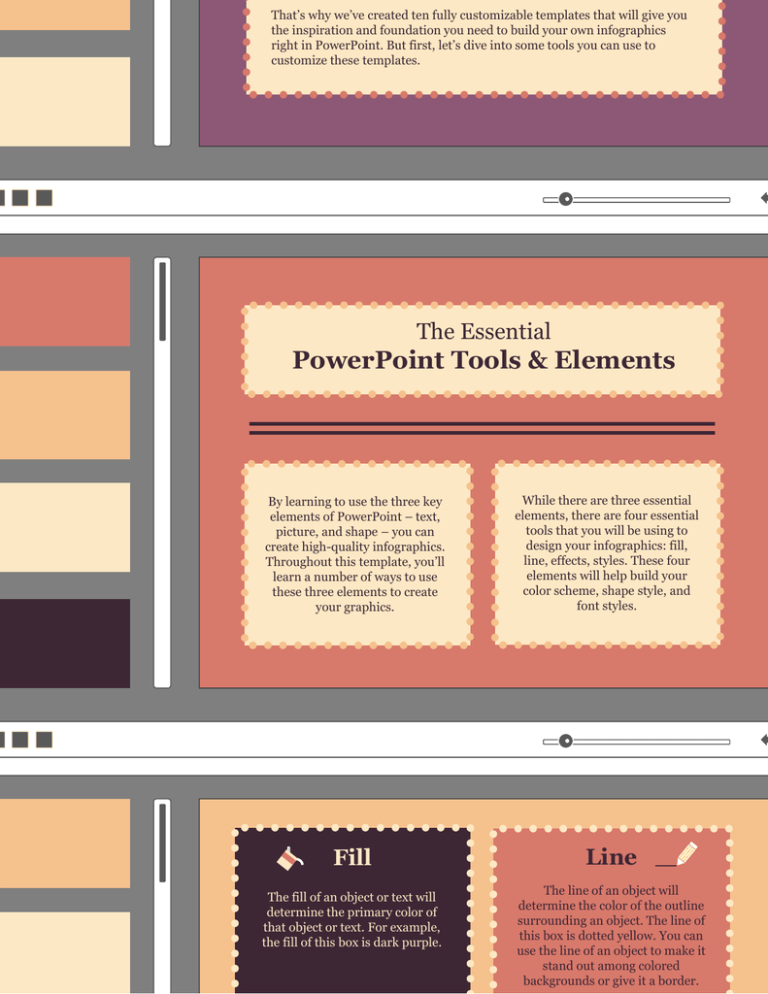
That’s why we’ve created ten fully customizable templates that will... the inspiration and foundation you need to build your own...
advertisement

That’s why we’ve created ten fully customizable templates that will give you the inspiration and foundation you need to build your own infographics right in PowerPoint. But first, let’s dive into some tools you can use to customize these templates. The Essential PowerPoint Tools & Elements By learning to use the three key elements of PowerPoint – text, picture, and shape – you can create high-quality infographics. Throughout this template, you’ll learn a number of ways to use these three elements to create your graphics. Fill The fill of an object or text will determine the primary color of that object or text. For example, the fill of this box is dark purple. While there are three essential elements, there are four essential tools that you will be using to design your infographics: fill, line, effects, styles. These four elements will help build your color scheme, shape style, and font styles. Line The line of an object will determine the color of the outline surrounding an object. The line of this box is dotted yellow. You can use the line of an object to make it stand out among colored backgrounds or give it a border. 8x this circle! Highlight a stat in this circle! e this text box to provide a nugget of w information or to describe the data own above (or below). 50% Here’s another space for a stat! 42x 101 Here’s another space for a stat! Here’s another space for a stat! $5k Here’s another space for a stat! WRITE A SECTION HEADER HERE Are you sure? Yes No How about this one? Yes Do you want to do that thing? Yes No No Did you know? 94% of people n the US wish they could live in a tree house. Sharing is caring. 86% of trees like to share with their friends. Stand tall. The tallest tree in the world is one million feet tall. This stat definitely not real. Don’t get your hopes up. Reduce, reuse, recycle. Placeholder This is placeholder text. Write something interesting here! 2008 Placeholder This is placeholder text. Write something interesting here! 2009 Placeholder 2010 This is placeholder text. Write something interesting here! Placeholder This is placeholder text. Write something interesting here! 2011 Placeholder This is placeholder text. Write something 2012 Placeholder This is placeholder text. Write something Use this text box to give some more context about the data you’re displaying. How is it helping to drive home your main point(s)? Is there anything confusing that needs to be explained in more detail? Use the line graph below to compare values over time. Like pie charts, these doughnut charts are great for showing parts of a whole. from an assortment of shapes, it can help to “group” those shapes when you need to resize or move them around your infographic. BAR GRAPHICS CAN BE EASILY MADE Learn to use a variety of shapes to create interesting graphs, charts, and other visualizations to show off your data points. You can do this by right clicking the object above, navigate to “Grouping,” and click “Ungroup” to break this object into its individual shapes. To regroup it, just highlight all the pieces, right click, and choose “Group” from the menu. Hold the Shift key to select more than one element at a time. SHAPES THAT LOOK LIKE GRAPHS ch of these icons was created from ividual shapes and lines offered by werPoint. Using a combination of basic apes, rectangles, and lines, we were able create some commonly used icons for ographics. n’t forget to hold the Shift key when ecting multiple pieces of one icon. Once u’ve selected each element of the icon, u should “group” it so that you can more sily move and scale the object. You should start by choosing a base colo We used white as the base color of our icons and blue or red to create the detail 31 LAPTOP OR MOBILE PHONE? VS The right image performed X% better than the left image. ONE OR TWO? VS 100 WILL SHARE THIS SHAPES TIME 68 CAN BE USED TO CREATE GRAPHICS YEARS UNTIL PUPPIES TIMELINES TAKE OVER THE VIDEOS OF CATS WORLD STATEMENTS 2012 INBOUND MARKETERS ARE RESPONSIBLE FOR FINDING LIFE ON MARS ATTENTION SPAN OF PEOPLE 9 YOU CAN’T CATCH APPLES BY THROWING ORANGES 2015 GRAPHS 10 RANDOM THOUGHTS 2014 2013 8 7 6 5 4 3 2 1 2012 2013 400 BILLION STARS IN THE MILKY WAY 2014 2015


