Document 14838302
advertisement

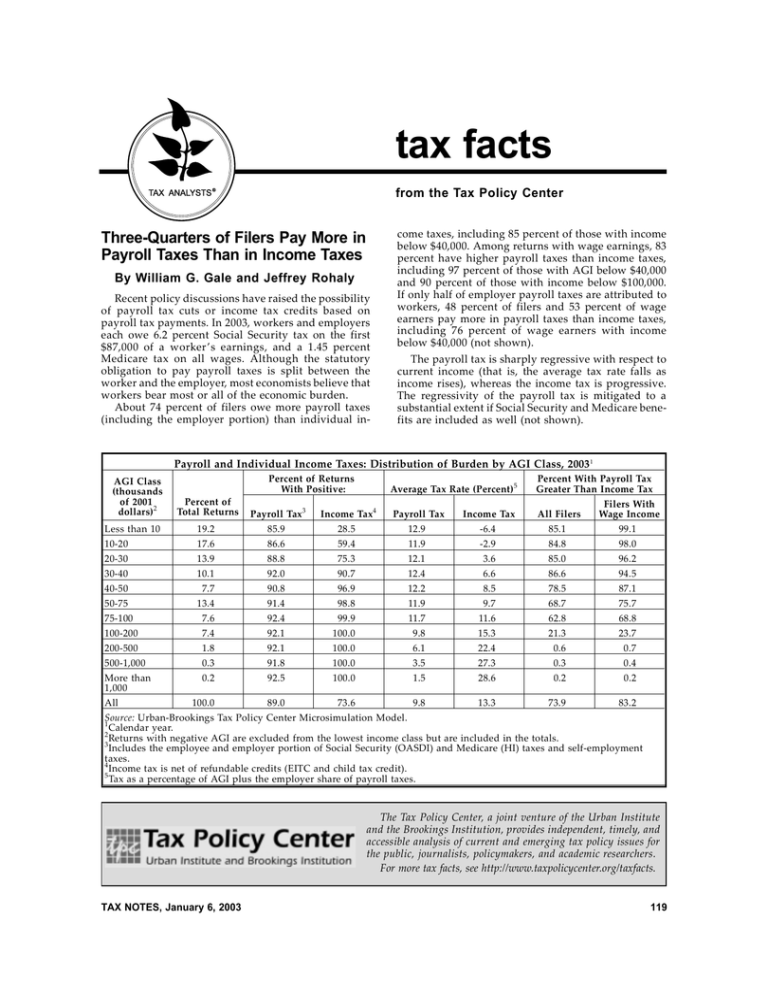
tax facts from the Tax Policy Center TAX ANALYSTS ® u g sw tp cC P x ,T h o R Jfry d .en G ilam W Three-Quarters of Filers Pay More in Payroll Taxes Than in Income Taxes By William G. Gale and Jeffrey Rohaly Recent policy discussions have raised the possibility of payroll tax cuts or income tax credits based on payroll tax payments. In 2003, workers and employers each owe 6.2 percent Social Security tax on the first $87,000 of a worker ’s earnings, and a 1.45 percent Medicare tax on all wages. Although the statutory obligation to pay payroll taxes is split between the worker and the employer, most economists believe that workers bear most or all of the economic burden. About 74 percent of filers owe more payroll taxes (including the employer portion) than individual in- come taxes, including 85 percent of those with income below $40,000. Among returns with wage earnings, 83 percent have higher payroll taxes than income taxes, including 97 percent of those with AGI below $40,000 and 90 percent of those with income below $100,000. If only half of employer payroll taxes are attributed to workers, 48 percent of filers and 53 percent of wage earners pay more in payroll taxes than income taxes, including 76 percent of wage earners with income below $40,000 (not shown). The payroll tax is sharply regressive with respect to current income (that is, the average tax rate falls as income rises), whereas the income tax is progressive. The regressivity of the payroll tax is mitigated to a substantial extent if Social Security and Medicare benefits are included as well (not shown). Payroll and Individual Income Taxes: Distribution of Burden by AGI Class, 2003 1 AGI Class (thousands of 2001 dollars) 2 Average Tax Rate (Percent) 5 Percent With Payroll Tax Greater Than Income Tax Income Tax4 Payroll Tax All Filers Percent of Returns With Positive: Percent of Total Returns Payroll Tax 3 Income Tax Filers With Wage Income Less than 10 19.2 85.9 28.5 12.9 -6.4 85.1 99.1 10-20 17.6 86.6 59.4 11.9 -2.9 84.8 98.0 20-30 13.9 88.8 75.3 12.1 3.6 85.0 96.2 30-40 10.1 92.0 90.7 12.4 6.6 86.6 94.5 40-50 50-75 7.7 13.4 90.8 91.4 96.9 98.8 12.2 11.9 8.5 9.7 78.5 68.7 87.1 75.7 75-100 7.6 92.4 99.9 11.7 11.6 62.8 68.8 100-200 7.4 92.1 100.0 9.8 15.3 21.3 23.7 200-500 1.8 92.1 100.0 6.1 22.4 0.6 0.7 500-1,000 0.3 91.8 100.0 3.5 27.3 0.3 0.4 More than 1,000 All 0.2 92.5 100.0 1.5 28.6 0.2 0.2 100.0 89.0 73.6 9.8 13.3 73.9 83.2 Source: Urban-Brookings Tax Policy Center Microsimulation Model. 1 Calendar year. 2 Returns with negative AGI are excluded from the lowest income class but are included in the totals. 3 Includes the employee and employer portion of Social Security (OASDI) and Medicare (HI) taxes and self-employment taxes. 4 Income tax is net of refundable credits (EITC and child tax credit). 5 Tax as a percentage of AGI plus the employer share of payroll taxes. The Tax Policy Center, a joint venture of the Urban Institute and the Brookings Institution, provides independent, timely, and accessible analysis of current and emerging tax policy issues for the public, journalists, policymakers, and academic researchers. For more tax facts, see http://www.taxpolicycenter.org/taxfacts. TAX NOTES, January 6, 2003 119

