Trends That Shape Our Future Personal - Family Personal - Education
advertisement

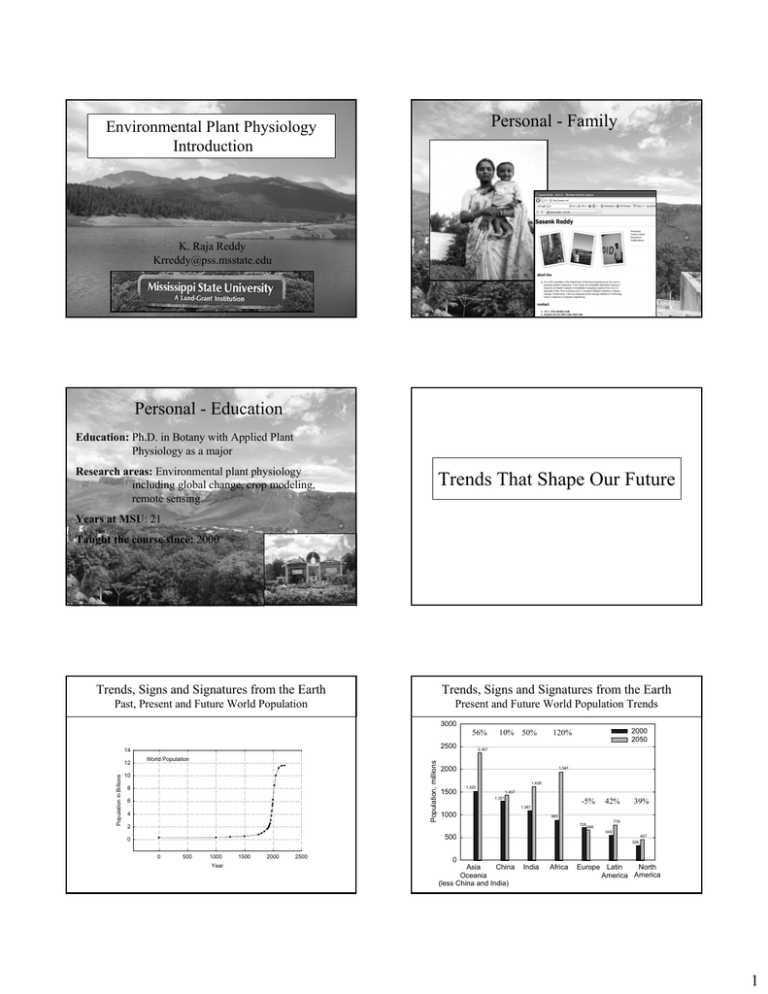
Personal - Family Environmental Plant Physiology Introduction K. Raja Reddy Krreddy@pss.msstate.edu Personal - Education Education: Ph.D. in Botany with Applied Plant Physiology as a major Research areas: Environmental plant physiology including global change, crop modeling, remote sensing. Trends That Shape Our Future Years at MSU: 21 Taught the course since: 2000 Trends, Signs and Signatures from the Earth Trends, Signs and Signatures from the Earth Past, Present and Future World Population Present and Future World Population Trends 3000 56% 2500 14 World Population Population, millions Population in Billions 12 10 8 6 4 10% 50% 2000 2050 120% 2,367 2000 1,941 1,628 1500 1,520 1,437 1,301 -5% 42% 39% 1,087 1000 885 728 2 778 668 549 500 0 0 500 1000 Year 1500 2000 2500 457 326 0 Asia China Oceania (less China and India) India Africa North Europe Latin America America 1 Trends, Signs and Signatures from the Earth Trends, Signs and Signatures from the Earth Maize - Production and Yield – Selected Countries Maize - Production and Yield – Selected Countries 50 Year 2004, Area = 147.02 Mha, Production = 721.4 MMt 40 Area Production 35 350 10000 35 30 30 25 25 20 20 15 15 10 10 5 5 P= 67%, and A= 46% Yield Production USA: 156% @ 114 kg yr-1 China: 335% @ 100 kg yr-1 USA: 226% @ 3.90 MMt yr-1 China: 631% @ 2.77 MMt yr-1 Brazil: 364% @ 0.73 MMt yr-1 Brazil: 157% @ 47 kg yr-1 300 250 Maize yield, kg ha-1 40 12000 45 Maize production, % 8000 USA USA 200 6000 150 China 4000 China 100 Brazil Nigeria Brazil 50 0 South Africa Argentina Indonesia India Romania France Brazil Mexico USA 0 China 2000 0 1960 1970 1980 1990 2000 2010 1960 1970 1980 Year 1990 0 2010 2000 Year Trends, Signs and Signatures from the Earth Trends, Signs and Signatures from the Earth Wheat - Production and Yield – Selected Countries Wheat - Production and Yield – Selected Countries 20 20 Year 2004, Area = 215.8 Mha, Production = 627.1 MMt Year 2004 4500 150 Production Yield -1 4000 China: 651% @ 88kg yr 15 10 10 5 5 -1 China: 539% @ 2.42 MMt yr USA: 80% @ 26 kg yr-1 China -1 3500 India: 210% @ 50 kg yr USA: 76% @ 1.62 MMt yr -1 125 India: 555% @ 0.69 MMt yr-1 USA Wheat yield, kg ha-1 15 Wheat production, % Wheat production area, % Area Production China 3000 2500 USA India 100 75 2000 1500 50 Wheat production, MMt Maize production area, % 45 Maize production, MMt 50 India 25 0 500 0 1960 1970 1980 1990 2000 2010 1960 1970 1980 Year 1990 2000 0 2010 Year Trends, Signs and Signatures from the Earth Trends, Signs and Signatures from the Earth Rice - Production and Yield – Selected Countries Rice - Production and Yield – Selected Countries 35 35 8000 Year 2004, Area = 151.3 Mha, Production = 605.8 MMt 250 Production -1 China: 232% @ 2.98 MMt yr -1 India: 339% @ 2.15 MMt yr Yield 30 0 China: 205% @ 102 kg yr -1 Indonesia: 156% @ 77 kg yr -1 India: 90% @ 42 kg yr -1 6000 Rice yield, kg ha-1 0 India 5 China 5 Indonesia 10 Bangladesh 10 Vietnam 15 Thailand 15 Myanmar 20 Brazil 20 Philippines 25 USA 25 7000 Rice production, % Area Production Japan Rice production area, % 30 Indonesia: 132% @ 1.12 MMt yr -1 200 China China 150 India 100 5000 4000 Indonesia 3000 50 India Rice production, MMt Kazakhstan Pakistan Argentina Turkey Ukraine Australia Canada France Germany USA Russian Fed. China 0 India 1000 Indonesia 2000 0 1000 P= 60%, and A= 55% 0 1960 1970 1980 1990 Year 2000 2010 1960 1970 1980 1990 2000 2010 Year 2 Trends, Signs and Signatures from the Earth Trends, Signs and Signatures from the Earth Soybean - Production and Yield – Selected Countries Soybean - Production and Yield – Selected Countries 100 Area Production 3000 60 60 40 40 20 20 2500 100 USA Yield 80 Production USA: 69% @ 26kg yr-1 Brazil: 103% @ 37 kg yr-1 China: 168% @ 26 kg yr-1 USA USA: 364% @ 1.35 MMt yr-1 Brazil: @ 0.99 MMt yr-1 China: 183% @ 0.24 MMt yr-1 75 Brazil Soybean yield, kg ha-1 80 Soybean production, MMt Soybean production area, Mha Year 2004, Area = 91.44 Mha, Production = 204.3 MMt Soybean production, MMt 100 2000 Brazil China 50 1500 25 China 0 Italy Bolivia Indonesia Canada Paraguay India China USA Brazil 0 Argentina 1000 500 1960 1980 1990 2000 2010 1960 1970 Year 1980 1990 2000 0 2010 Year Trends, Signs and Signatures from the Earth Trends, Signs and Signatures from the Earth Cotton - Production and Yield – Selected Countries Global Major Foods – Meat and Poultry Production 4000 China: 649% @ 0.29 MMt yr-1 USA: 45% @ 0.09 MMt yr-1 India: 172% @ 0.08 MMt yr-1 20 10 300 China 2500 15 China 2000 USA 10 1500 USA 1000 5 India 500 India Poultry Meat 250 200 150 100 50 0 1950 1960 1970 1980 1990 2000 Year 0 1960 1970 1980 1990 2000 2010 1960 1970 Year 1980 1990 Meat and Poultry Production Relative Trends Meat and Poultry Production 2000 0 2010 2010 Meat and Poultry production trends,1961 = 1 Production China: 409% @ 58 kg yr-1 USA: 72% @ 16 kg yr-1 India: 141% @ kg yr-1 Meat and Poultry production, million t 3000 25 Yield Cotton production, MMt 3500 9 1961 to 2007: Million t Poultry = 9 and 87 Meat = 71 and 286 8 Poultry 7 6 5 4 Meat 3 2 1 0 1960 1970 Year 1980 1990 2000 2010 Year Trends, Signs and Signatures from the Earth Trends, Signs and Signatures from the Earth Global Major Foods – Per Capita Consumption Cropland area, Irrigation and Salinization 450 Vegetables = 3.21 lb/year Percentage change from Year 1985 to 2000 400 Consumtion, lb/person Seed cotton yield, kg ha-1 1970 Cropland area 350 Selected fruits = 1.95 lb/year 300 250 Meat and Poultry = 0.65 lb/year 200 150 Irrigated area Salinized area ----------------------------- Mha -------------------------------China 124.0 54.4 (22%) 7-8 India 161.8 54.8 (31%) 10-30 (50%) (14%) USA 177.0 22.4 (13%) 4.5 -6 (15%) USSR 204.1 19.9 (2%) 2.5-4.5 (21%) World 1364.2 271.7 (21%) 62-82 (37%) Flour and Cereals = 2.70 lb/year 100 1965 1970 1975 1980 1985 Year 1990 1995 2000 S.G. Pritchard and J. S. Amthor, 2005 3 Trends, Signs and Signatures from the Earth Trends, Signs and Signatures from the Earth Management Practices Population, cereal yield, arable and irrigated area, N use 4 Soil organic carbon (%) Soil organic carbon (%) 2.5 2.0 1.5 1.0 Corn-oats-hay rotation Corn-oats (1885-1953), Corn-soybeans (1954-1988) Continuous corn Relative valuses (1961=1) Sanborn Field: Central Missouri Morrow plots: East-central Illinois 3.5 3.0 5 Fertility management Crop rotations 4.0 Estimated to 4% in 1888 Wagner, (1989) 3 2 1 Wheat, 6 Tons Manure/year Corn, 6 Tons Manure/year Continuous Wheat Continuous Corn 0 1880 1880 1900 1920 1940 1960 1980 2000 Year Reicosky et al. 2000 1900 1920 1940 Year 1960 • The average world current cereal yield is about 3 tons per ha for about 6.4 billion people. • We need about 4 tons per ha for 8 billion (33 % more than the current), and 5 tons per ha for 10 billion (67 % more than the current). Here comes the greatest challenge of our time, The Global Climate Change 3 4 2000 values are: Cereal yield = 2.25 Arable area = 1.09 Irrigated area = 1.98 Population = 1.97 Fertilizer use = 4.33 3 2 2 1 1 0 0 1955 1960 1965 1970 1975 1980 1985 1990 1995 2000 2005 1980 Year Routes to Greater Food Production Feeding 10 Billion Mouths We must develop the capacity to feed 10 billion people within in the next 40 to 50 years. 4 5 Cereal yield Arable land area Irrigated land area Population Fertilizer use • Increase in the area of land under cultivation. • Increase in the number of crops per hectare per year (mostly practiced in tropics, requires access to irrigation, high input use, short season cultivars, and others such as labor, pest and disease control may be a problem). • Displacement of lower yielding crops by higher yielding ones (done since the dawn of domestication). • Efficiency of crop production in terms of: Per unit of land area (yield per ha) Per unit of time Per unit of inputs such as fertilizers, water and labor etc. Trends, Signs and Signatures from the Earth • Greenhouse gases (CO2, CH4, N2O etc.) • Temperatures • Glaciers, oceans and sea-levels • Precipitation patterns and drought intensities • Extreme events • Higher ozone and UV-B radiations 4 Global Warming and the Ozone Story Global Warming Process Trends, Signs and Signatures from the Earth Past and Current Levels in GHG Concentrations, Rates of Change and Atmospheric Lifetime Ozone Depleting Process CFCs are commonly used as refrigerants, solvents, and foam blowing agents. The most common CFCs are CFC-11, CFC12, CFC-113, CFC-114, and CFC-115. Global warming gases CO2 Methane Nitrous oxide CFC-11 HFC-23 Perfluromethane Pre-industrial concentration (1850) about 280 ppm about 700 ppb about 270 ppb 0 0 40 ppt Current Concentration in 2008 386 ppm 1857 ppb 321 ppb 244 ppt 18 ppt 74 ppt Rate of change 1.43 ppm/yr 7.0 ppb/yr 0.8 ppb/yr -1.4 ppt/yr 0.55 ppt/yr 1 ppt/yr Atmospheric lifetime 5 to 200 years 12 years 114 years 45 years 260 Years >50,000 years Trends, Signs and Signatures from the Earth Trends, Signs and Signatures from the Earth Spatial and temporal trends in climate Future trends in global carbon dioxide concentration and associated climate change, if no interventions are made 2025 Carbon dioxide concentration 405-460 ppm Global mean temperature change from the year 1990 0.4-1.1 oC Global mean sealevel rise from the year 1990 3-14 cm 2050 40 35 Hyderabad, India 2100 445-640 ppm 720-1020 ppm 2.4-6.4 oC 0.8-2.6 oC 5-32 cm 26-59 cm Temperature, °C Climate variable Ozone depleting chemicals Period Phoenix, AZ, USA 30 25 Maros Indonesia 20 15 10 5 Stoneville, MS, USA 0 0 50 100 150 200 250 300 350 Day of the Year Trends, Signs and Signatures from the Earth Present and Projected Temperature Changes • As human population expands and demand upon natural resources increases, the need to manage the environments in which people live becomes more important, but also more difficult. • Climate change has no boundaries, and can’t be viewed in isolation. 50 40 Temperature, oC Climate Change and Crop Productivity Some Considerations 30 20 Hyderabad Stoneville, MS Stoneville, MS + Projected climate Hyderabad + Projected climate Optimum temperature for Rice 10 0 0 60 120 180 240 300 360 • We should consider other stresses on food production systems such as population dynamics, habitat destruction and fragmentation, land-use changes, biodiversity, land and water management and invasive species dominance. Day of the year 5 Climate Change and Crop Productivity Some Considerations • Land and water management is especially critical as the use of upstream watersheds can drastically affect large numbers of people living in downstream watersheds. • The current and projected changes in climate are unprecedented, and the ecosystems including managed ecosystems such as agriculture may not cope with the changes projected in climate. • An integrated approach that stresses both the importance of participatory planning and the institutional and technical constraints and opportunities is therefore necessary. Environmental Stresses and Plant Growing Conditions Environmental and Cultural Factors Limiting Potential Yields Area of Total World Land Surface Subject to Environmental Limitations of Various Types Limitation ¾ Atmospheric carbon dioxide ¾ Solar radiation ¾ Temperature (including extremes) ¾ Water (irrigation and rainfall) ¾ Wind ¾ Nutrients (N, P, K, and other nutrients) ¾ Others, Ultra-violet radiation, ozone etc., ¾ Growth regulators (such as PIX) Environmental Plant Physiology Objectives • The objectives of this course are to learn plant responses to abiotic stresses, particularly plant growth and development, and to learn modeling methodologies on how to integrate those plant processes under multiple stress conditions. • At the end, the students are expected to: Area of world soil subject to limitation (%) Drought 27.9 Shallow soil 24.2 Mineral excess or deficiency 22.5 Flooding 12.2 Miscellaneous 3.1 None 10.1 Total 100 Temperature 14.8 (over laps with other stresses) Environmental Plant Physiology Chapter 1 • Atmospheric carbon dioxide • Solar radiation • Temperature (Including extremes) • Water 9 understand individual as well as interactive abiotic stress effects on photosynthesis, respiration, growth, development and finally yield. • Wind 9 understand on how to develop methodologies to integrate multiple stress factor effects on various plant/canopy processes. • Other factors such as ozone • Nutrients • Plant growth regulators • The facilities and tools 6 Environmental Plant Physiology Chapter 2 Photosynthesis and the environment • The Environmental productivity Index (EPI) concept. • The photosynthesis - Species variability. • Photosynthesis and aging process. • Respiration. Environmental Plant Physiology Chapter 4 Scaling of processes from leaves to whole plant, canopies or ecosystems. Chapter 5 Special topics include: • Plant growth regulators – PIX. • Remote sensing and environmental plant physiology. Environmental Plant Physiology Chapter 3 Crop growth and development • Phenology • Growth of various organs and whole plants. • The concept of environmental productivity index in quantifying crop growth and development in response to the environment. Environmental Plant Physiology Introduction Suggested reading: Feeding the Ten Billion-Plants and Population Growth- 1998, L. T. Evans, Chapter 12, pages 195-225. Crop Science Progress and Prospects- 2000, edited by J. Nosberger, H. H. Geiger and P. C. Struik, Chapter 3, Crop Science research to assure food security by K.G. Cassman, pages, 33-51. Crop Responses to Environment –2001, A. E. Hall. Chapter 1, Introduction, pages 1-7. Meeting cereal demand while protecting natural resources and improving environmental quality, KG Cassman, A. Dobermann, DT Walters and H. Yang, Annual Review of Environmental Resources, 2003, 28:315-358. 7


