Document 14642077
advertisement
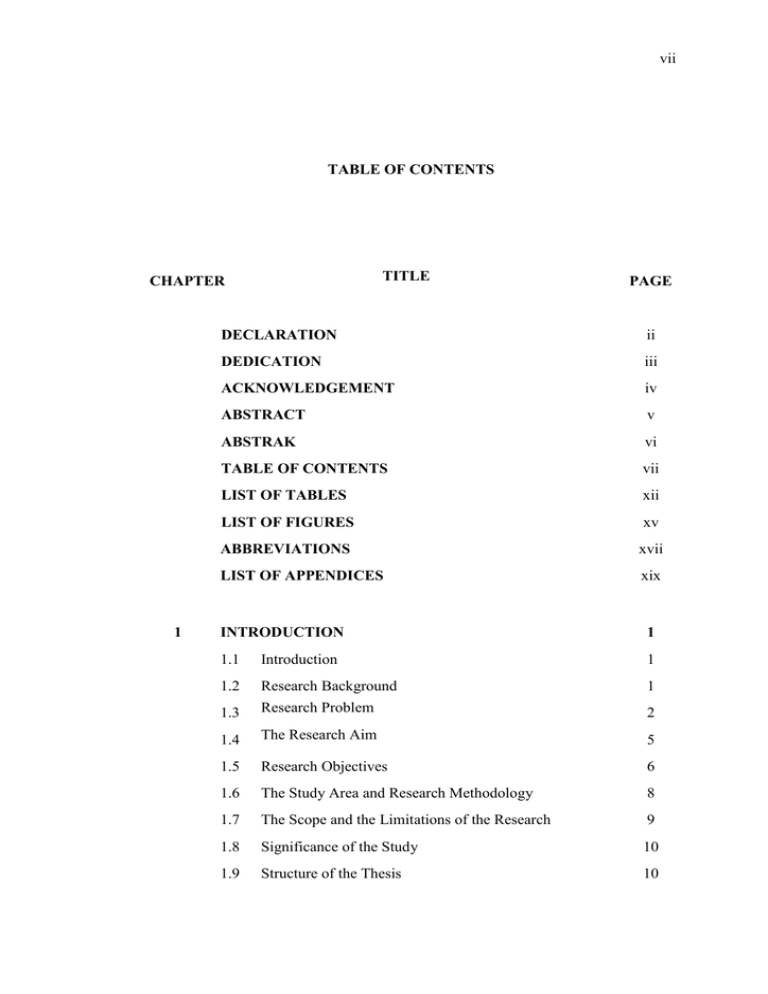
vii TABLE OF CONTENTS TITLE CHAPTER 1 PAGE DECLARATION ii DEDICATION iii ACKNOWLEDGEMENT iv ABSTRACT v ABSTRAK vi TABLE OF CONTENTS vii LIST OF TABLES xii LIST OF FIGURES xv ABBREVIATIONS xvii LIST OF APPENDICES xix INTRODUCTION 1 1.1 Introduction 1 1.2 Research Background 1 1.3 Research Problem 2 1.4 The Research Aim 5 1.5 Research Objectives 6 1.6 The Study Area and Research Methodology 8 1.7 The Scope and the Limitations of the Research 9 1.8 Significance of the Study 10 1.9 Structure of the Thesis 01 viii 2 LITERATURE REVIEW 2.1 Walking Behavior and the Role of Environmental Factors 01 2.1.1 Introduction 11 2.1.2 The Contribution of Trip’s Purposes to the Walking Behavior 2.1.3 Walking to Reach a Destination 2.2 2.3 2.5 15 Effects of the Built Environment on Walking and Path Choice Criteria 16 2.1.5 Commuters and Walking for Transport in CBD 17 2.1.6 Summary 17 Wayfinding and the Path Choice of Pedestrians 18 2.2.1 Human Wayfinding, Path Choice and the Role of Spatial Representation 18 2.2.2 Taxonomy of Wayfinding and the Role of the Familiarity 21 2.2.3 Legibility and Wayfinding Performance 23 2.2.4 Summary 23 Behavioral Models on the Path Choice and Walking of Pedestrians 24 The Behavioral Models of Pedestrians’ Walking and their Path Choice 24 2.3.2 Summary and the Argument 29 Factors Affecting the Path Choice of Pedestrians and Commuters 29 2.4.1 Summary and the Argument 34 The Perceived Time and Cognitive Distance 37 2.5.1 Introduction 37 2.5.2 2.6 11 2.1.4 2.3.1 2.4 12 Hypotheses and Empirical Findings on the Cognitive Distance and the Perceived Time 37 2.5.3 Summary 40 The Perceived Complexity of the Commuters 41 2.6.1 Definition of the Complexity and its Related Factors in Different Studies 41 ix 2.6.2 Complexity and Aesthetic in the Urban Design 42 2.6.3 Complexity of the Pathways and Path Choice Criteria of Commuters 43 2.6.4 Definition of the Perceived Complexity for Commuters 44 2.6.5 2.6.6 2.6.8 The Perceived Complexity and the Related Physical Factors 49 2.6.9 Summary 50 The Perceived Legibility of Commuters 51 2.7.1 Definition of Legibility and its Related Factors 51 2.7.2 Legibility and Walkability of Pathways in the Urban Environments 52 2.7.3 Legibility and Wayfinding in the Pathways 52 2.7.4 Legibility and Aesthetic Experiences in the Urban Design 52 2.7.5 Definition of the Perceived Legibility for Commuters 53 2.7.6 The perceived Legibility and the Estimated Distance as well as Time 56 2.7.8 2.7.9 3 47 48 2.7.7 2.8 45 The Perceived Complexity and Aesthetic Experience in Relation to the Path Choice of Commuters 2.6.7 2.7 The Perceived Complexity and the Estimated Distance as well as Time Perceived Complexity and Comfort as One of the Path Choice Criteria of Commuters The Perceived Legibility and Aesthetic Experience in Relation to the Path Choice of Commuters The Perceived Legibility and the Related Physical Factors 56 Summary 58 Conclusion 57 58 RESEARCH DESIGN AND METHODOLOGY 62 3.1 62 Research Framework x 3.2 The Central Business District of Kuala Lumpur and its Characteristics 67 3.3 The Zone Selection Process in CBD of Kuala Lumpur 68 3.3.1 4 The First Step, Selection of Zones on the Basis of the Map 71 3.3.1.1 Phase 1: Using Typology of Heritage Zones as the Basis of Zone Selection 70 3.3.1.2 Phase 2: Selection of Stations 76 3.3.1.3 Phase3: Selection of Workplaces around the Selected Stations 77 3.3.1.4 Phase 4: Checking the Selected Zones in Terms of Meeting Certain Primitive Criteria 81 3.3.2 The Second Step (Field Observational Step) 82 3.4 The First Objective, Hypotheses, the Adopted Methodology and the Designed Process of Examination 84 3.5 The Second Objective, the Adopted Methodology and the Designed Process of Examination 89 3.6 The Third Objective, the Adopted Methodology and the Designed Process of Examination 92 3.7 The Fourth Objective, Hypotheses, the Adopted Methodology and the Designed Process of Examination 98 3.7.1 The First Step 012 3.7.2 The Second Step 013 3.8 Reliability and Validity of the First and the Second Survey Questionnaires 015 3.9 Summary 007 RESULTS AND DISCUSSION 4.1 4.2 Results of Reliability and Validity of the First and the Second Survey Questionnaire The Importance of the Lowest PC and the Highest PL among the Other Probable Path Choice Criteria of Commuters 4.2.1 The first Step 109 109 101 002 xi 4.2.2 4.3 113 The physical factors related to PC and PL 121 4.3.1 The Physical factors related to the PC of Commuters 022 4.3.2 The Physical Factors Related to the PL of Commuters 026 Measuring PC and PL on the Basis of Their Related Physical Factors 036 4.4.1 The First Step 038 4.4.2 The Second Step 140 4.4.3 The Third Step on PC 044 4.4.4 The Third Step on PL 048 Examine the Indirect Contribution of Lowest PC and Highest PL to Path Choice of the Commuters 052 4.5.1 The First Step 052 4.5.2 The Second Step on PC 055 4.5.3 The Second Step on PL 057 4.6 An Additional Analysis 160 4.7 Summary 164 4.4 4.5 5 The Second Step CONCLUSION 165 1.0 Summary and Conclusion 165 1.2 Implication of the Research 172 5.3 Recommendations for Further Research 173 REFERENCES 175 Appendices A-C 193-203 xii LIST OF TABLES TITLE TABLE NO. 1.0 3.2 3.3 The Initial selected LRT and Monorail Stations PAGE 77 The selected workplaces and respected zones as the result of phase 3, in secondary heritage zone 79 The selected workplaces and respected zones as the result of phase 3, in tertiary heritage zone 79 The zones located in the secondary heritage zone which 3.4 should be excluded from further considerations as the results of phase four 81 The zones located in the tertiary heritage zone which should 3.5 be excluded from further considerations as the results of phase four 81 3.6 Zones included located in the secondary heritage zone 82 3.7 Zones included located in the tertiary heritage zone 82 3.8 Final zones of study located in secondary heritage zone 83 3.9 Final zones of study located in tertiary heritage zone 84 3.10 Table for Determining Sample Size from a Given Population 89 The results of validity test of the questions included the 4.1 definitions of the PC as well as the PL in the first survey due to the experts 110 The results of validity test of the questions included the 4.2 definitions of the PC as well as the PL in the first survey due to the commuters 4.3 4.4 110 The result of validity test of the questions for measuring the perceptual factors of this research 111 The results of first Survey regarding the preliminary evaluation of path choice criteria (first step) 112 xiii The importance of factors for path choice of commuters 4.5 while coming back from workplace to the station in evening trips 4.6 4.7 4.8 113 The importance of factors for path choice of commuters while going to workplace from the station in morning trips 114 The importance of the lowest PC for path choice based on gender difference 118 The importance of physical factors related to the PC for path choice based on gender difference 119 4.9 The importance of the highest PL for path choice based on gender difference 120 4.10 Physical factors related to higher PC based on the number of repetitions of each factor 4.11 The physical factors related to higher PC in the second survey 123 124 Name of the buildings and their types in each zone 4.12 mentioned by respondents in the first survey regarding more PL 127 The results of the first survey regarding the physical factors 4.13 related to higher PL based on the number of repetitions of each factor 4.14 4.15 4.16 4.17 4.18 4.19 130 The results of second survey regarding the physical factors related to higher PL 131 The results of path recognition in the zones of study located at secondary heritage zone 137 The results of path recognition in the zones of study located at tertiary heritage zone 137 The mean difference of the PC among the traversed ways of commuters 138 The mean difference of the PL among the traversed ways of commuters 139 Inter-rater Reliability for Estimates of Physical Factors 144 xiv 4.20 4.21 4.22 Summary of Regression Equation among the PC and rates of its related physical factors 144 Analysis regression variance among the PC and rates of its related physical factors 145 Multiple Regression equation analysis among the PC and rates of its related physical factors 145 Multiple Regression equation analysis after eliminating the 4.23 insignificant factors among the PC and rates of its related physical factors 4.24 4.25 4.26 146 Summary of Regression Equation among the PL and rates of its related physical factors 148 Analysis regression variance among the PL and rates of its related physical factors 149 Multiple Regression equation analysis among PL and rates of its related physical factors 149 Multiple Regression equation analysis after eliminating the 4.27 insignificant factors among the PL and rates of its related physical factors 4.28 4.29 150 Pearson correlation analysis between rate of the PC and the perceived time, rates of pleasance and rates of comfort 156 Pearson correlation analysis between rate of the PL and perceived time, and rates of pleasance 158 Pearson correlation analysis between representative physical 4.30 factors of the PC and the correlated perceptual factors to the PC 161 Pearson correlation analysis between representative physical 4.31 factor of the PL and the correlated perceptual factors to the PL 162 xv LIST OF FIGURES TITLE FIGURE NO. PAGE The presented scenarios in the case of the availability of 1.1 alternative pathways with almost the same length for commuters 1.2 4 The sequence of the study areas leading to define the research aim 6 2.1 The sequence of the content in the reviewed literature 13 2.2 Summary of path choice process 19 2.3 2.4 2.5 The relationships between the familiarity derived from the frequency of navigation and knowledge components 22 The pedestrian’s behavioral model suggested by Kitazawa and Batty (2004) 28 Framework on the most affective factors on path choice of commuters based on reviewed literature 35 The presented scenarios in the case of the availability of 2.6 alternative pathways with almost the same length for commuters 2.7 2.8 2.9 2.10 36 The relationships between the complexity and certain path choice criteria of commuters 43 The procedure of defining the perceived complexity 45 The relationships between the PC of commuters and the sense of comfort 48 The procedure of defining PL in this research 55 The Theoretical Framework-Expected Path Choice Criteria 2.11 3.1 of Commuters Consisting of the PC and the PL, identified in this research 60 The research framework 65 xvi 3.2 3.3 The reasons of necessity of equalizing the length of the 66 traversed pathways of commuters in the selected zones The Methodological steps and tools used to examine the objectives of this study 66 3.4 Main Zones of Kuala Lumpur 68 3.5 The zone selection process in CBD of Kuala Lumpur 70 3.6 3.7 3.8 3.9 The Conservation (Heritage) map and its different area’s types inside the city center or CBD of Kuala Lumpur 72 Areas within the metro stations in CBD 73 Different heritage zones of conservation map inside the city center or CBD of Kuala Lumpur 74 Illustration of the process to find the workplaces around the selected stations 78 3.10 The process of examining the first objective 87 3.11 The research framework regarding the first objective 89 3.12 The Process of examining the second objective 91 3.13 The Process of examining the third objective 94 The perceptual and physical path choice criteria of 3.14 commuters, as assumed related factors to the PC of commuters 3.15 3.16 99 The perceptual and physical path choice criteria of commuters, as assumed related factors to PL of commuters 100 The process of examining the fourth objective 101 The process of examining the objectives of this research 3.17 4.1 4.2 4.3 based on the related research tools, adopted for consequent steps of each objective 104 The factors contributing to path choice for commuters 115 The physical factors related to more difficulty of walking movement or higher PC 125 Number of the mentioned buildings and their repetition based on their types regarding higher PL 128 xvii 4.4 4.5 4.6 4.7 4.8 4.9 4.10 4.11 4.12 4.13 4.14 4.15 The physical factors related to stronger sense of direction toward the destinations or higher PL 132 Evaluation of normal distribution of data regarding rate of the PC 139 Evaluation of normal distribution of data regarding rate of the PL 140 The process of categorizing the physical factors related to the PC into different related measurable physical factors 141 The process of categorizing the physical factors related to the PL into different related measurable physical factors 142 The results of the Regression analysis regarding the correlation between rate of the PC and the physical factors 146 The results of the Regression analysis regarding the correlation between rate of the PL and the physical factors 150 The results of the first step of examining the fourth objective regarding the lowest PC 153 The results of the first step of examining the fourth objective regarding the highest PL 154 The results of the first and second step of examining the fourth objective regarding the lowest PC 157 The results of the first and second step of examining the fourth objective regarding the highest PL 158 The process which shows how the question discussed in this section is raised 160 The significant correlations between perceptual factors 4.16 related to the PC and the representative physical factors of the PC in the context 161 The significant correlations between perceptual factors 4.17 5.1 related to the PL and the representative physical factors of the PL in the context 163 The Overview of the Findings 167 xviii LIST OF SYMBOLS PC - Perceived complexity PL - Perceived legibility CBD - Central Business District xix LIST OF APPENDICES APPENDIX A TITLE The Reliability Tests of First and Second Survey Questionnaire PAGE 193 B First Survey Questionnaire 196 C Second survey questionnaire 199
