Assignment 8: Log and Semi-log Review
advertisement
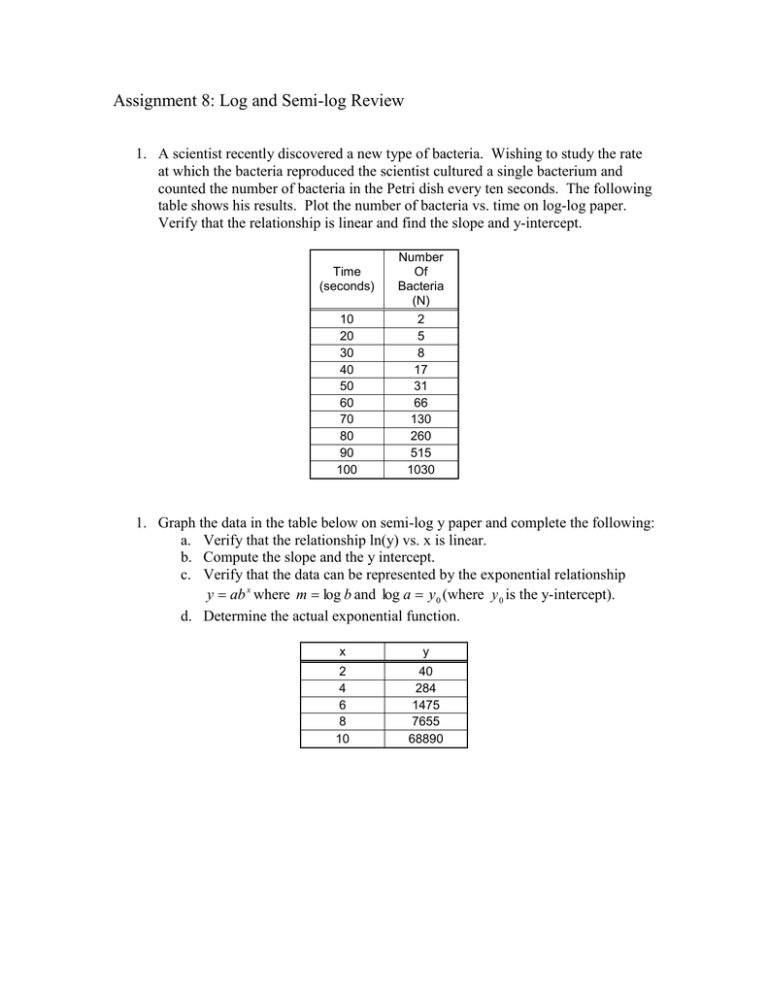
Assignment 8: Log and Semi-log Review 1. A scientist recently discovered a new type of bacteria. Wishing to study the rate at which the bacteria reproduced the scientist cultured a single bacterium and counted the number of bacteria in the Petri dish every ten seconds. The following table shows his results. Plot the number of bacteria vs. time on log-log paper. Verify that the relationship is linear and find the slope and y-intercept. Time (seconds) 10 20 30 40 50 60 70 80 90 100 Number Of Bacteria (N) 2 5 8 17 31 66 130 260 515 1030 1. Graph the data in the table below on semi-log y paper and complete the following: a. Verify that the relationship ln(y) vs. x is linear. b. Compute the slope and the y intercept. c. Verify that the data can be represented by the exponential relationship y ab x where m log b and log a y 0 (where y 0 is the y-intercept). d. Determine the actual exponential function. x y 2 4 6 8 10 40 284 1475 7655 68890
