Project Monitoring & Controlling Earned Value Analysis Monitoring 433-643 IT Project Management
advertisement
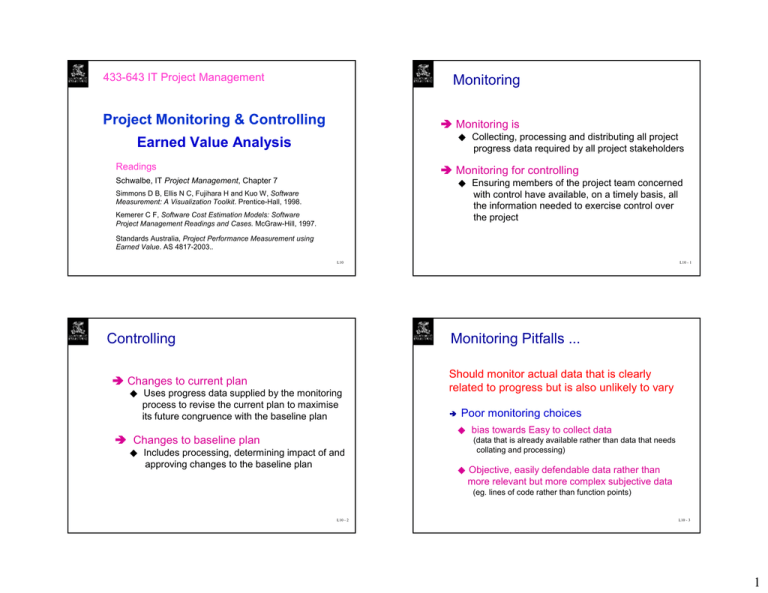
433-643 IT Project Management Monitoring Project Monitoring & Controlling Ä Monitoring is ◆ Collecting, processing and distributing all project progress data required by all project stakeholders Earned Value Analysis Readings Ä Schwalbe, IT Project Management, Chapter 7 Monitoring for controlling ◆ Ensuring members of the project team concerned with control have available, on a timely basis, all the information needed to exercise control over the project Simmons D B, Ellis N C, Fujihara H and Kuo W, Software Measurement: A Visualization Toolkit. Prentice-Hall, 1998. Kemerer C F, Software Cost Estimation Models: Software Project Management Readings and Cases. McGraw-Hill, 1997. Standards Australia, Project Performance Measurement using Earned Value. AS 4817-2003.. L10 Controlling Ä L10 - 1 Monitoring Pitfalls ... Changes to current plan ◆ Uses progress data supplied by the monitoring process to revise the current plan to maximise its future congruence with the baseline plan Should monitor actual data that is clearly related to progress but is also unlikely to vary Poor monitoring choices ◆ bias towards Easy to collect data Ä Changes to baseline plan ◆ Includes processing, determining impact of and approving changes to the baseline plan (data that is already available rather than data that needs collating and processing) ◆ Objective, easily defendable data rather than more relevant but more complex subjective data (eg. lines of code rather than function points) L10 - 2 L10 - 3 1 Earned Value Chart Example – EVA for multiple activities Time ACWP Now Assume the following information is available Cost BCWS Schedule Variance Actual Cost ACWP Cost Variance (spending overrun) Baseline Cost Schedule Plan BCWS ATWP STWP BCWP Activity BAC ($’000) Duration (wks) Precedence A - Initiation 100 1 -- B - Planning 400 2 A A C - Designing 1200 3 D - Estimation 600 2 B E - Scheduling 200 1 D Earned Value BCWP Time Variance Time L10 - 4 EVA (at t = 4) - Multi Activities L10 - 5 Activity A at time t = 4 t=4 Activity BAC A 100 B 400 C 1200 D 600 E 200 Planned Daily Cost BCW S Planned PC Activity A B C D E 100 200 400 100 100 4% 600 700 28% 200 400 600 1300 52% 400 300 700 2000 80% 300 300 2300 92% 200 200 2500 100% Total BAC 100 400 1200 600 200 BCW S 100 400 1200 300 0 2500 2000 PC 100% 100% 75% 25% 0% BCW P ACW P 100 100 400 500 900 1000 150 200 0 0 1550 1800 SV 0 0 -300 -150 0 CV 0 -100 -100 -50 0 EAC 100 500 1333 800 200 -450 -250 2903 Actual Data at time t = 4 Act A B C D E PC 100% 100% 75% 25% 0% BCWS BCWP SV CV FCAC ACWP $100 $500 $1000 $200 $0 L10 - 6 = Baseline PC * BAC = Actual PC * BAC = BCWP - BCWS = BCWP - ACWP = (ACWP/BCWP) * BAC = 100% * 100 = 100 = 100% * 100 = 100 =0 =0 = (100/100) * 100 = 100 L10 -7 2 Activity B at time t = 4 Activity A B C D E Total BCWS BCWP SV CV FCAC BAC 100 400 1200 600 200 BCW S 100 400 1200 300 0 2500 2000 PC 100% 100% 75% 25% 0% Activity C at time t = 4 BCW P 100 400 900 150 0 ACW P 100 500 1000 200 0 1550 1800 = Baseline PC * BAC = Actual PC * BAC = BCWP - BCWS = BCWP - ACWP = (ACWP/BCWP) * BAC SV 0 0 -300 -150 0 CV 0 -100 -100 -50 0 EAC 100 500 1333 800 200 -450 -250 2903 Activity A B C D E Total BCWS BCWP SV CV FCAC = 100% * 400 = 400 = 100% * 400 = 400 = 400 - 400 = 0 = 400 - 500 = - 100 = (500/400) * 400 = 500 BAC BCW S 100 100 400 400 1200 1200 600 300 200 0 2500 PC 100% 100% 75% 25% 0% BCW P A CW P 100 100 400 500 900 1000 150 200 0 0 2000 1550 = Baseline PC * BAC = Actual PC * BAC = BCWP - BCWS = BCWP - ACWP = (ACWP/BCWP) * BAC SV 1800 0 0 -300 -150 0 CV 0 -100 -100 -50 0 EAC 100 500 1333 800 200 -450 -250 2903 = 100% * 1200 = 1200 = 75% * 1200 = 900 = 900 - 1200 = - 300 = 900 - 1000 = - 100 = (1000/900) * 1200 = 1333 L10 -8 Activity E at time t = 4 Activity D at time t = 4 Activity A B C D E Total BCWS BCWP SV CV FCAC BAC BCWS 100 100 400 400 1200 1200 600 300 200 0 2500 PC 100% 100% 75% 25% 0% BCW P A CW P 100 100 400 500 900 1000 150 200 0 0 2000 = Baseline PC * BAC = Actual PC * BAC = BCWP - BCWS = BCWP - ACWP = (ACWP/BCWP) * BAC 1550 L10 -9 1800 SV 0 0 -300 -150 0 CV 0 -100 -100 -50 0 EAC 100 500 1333 800 200 -450 -250 2903 Activity A B C D E Total = 50% * 600 = 300 = 25% * 600 = 150 = 150 - 300 = - 150 = 150 - 200 = - 50 = (200/150) * 600 = 800 BCWS BCWP SV CV FCAC L10 -10 BAC 100 400 1200 600 200 BCW S 100 400 1200 300 0 2500 2000 PC 100% 100% 75% 25% 0% = Baseline PC * BAC = Actual PC * BAC = BCWP - BCWS = BCWP - ACWP = (ACWP/BCWP) * BAC BCW P ACW P 100 100 400 500 900 1000 150 200 0 0 1550 1800 SV 0 0 -300 -150 0 CV 0 -100 -100 -50 0 EAC 100 500 1333 800 200 -450 -250 2903 = 0% * 200 = 0 = 0% * 200 = 0 =0 =0 = (?) * 200 = 200 L10 -11 3 EVA (Another Measure) - Multi Activities EVA of whole Project at time t = 4 Activity A B C D E BAC BCWS 100 100 400 400 1200 1200 600 300 200 0 Total 2500 BCWS BCWP SV CV FCAC PC 100% 100% 75% 25% 0% BCW P ACW P 100 100 400 500 900 1000 150 200 0 0 2000 1550 = 2000 = 1550 = BCWP - BCWS = BCWP - ACWP = (ACWP/BCWP) * BAC 1800 SV 0 0 -300 -150 0 CV 0 -100 -100 -50 0 EAC 100 500 1333 800 200 -450 -250 2903 Ä Critical Ratio (Useful for Larger Projects) CR = (actual progress/scheduled progress)*(budget cost/actual cost) = (AP/SP)*(BCWP/ACWP) (assumes that two Ratios are weighted equally) Activity A B C D E = 1550 - 2000 = - 450 = 1550 - 1800 = - 250 = (1800/1550) * 2500 = 2,903 AP 2 2 3 3 3 SP 3 3 3 2 3 BCW P 6 6 4 6 6 ACW P 4 6 6 6 4 CR 1.00 0.67 0.67 1.50 1.50 Status On Behind Behind Ahead Ahead L10 -12 L10 - 13 WBS for the example software development project Another Simple Example Consider a project to develop a specialized software to control a packaging machine, and install it at the customer’s factory. Develop Design 1 activity number 4 2 6 Software Project $100,000 Install & Test 3 2 Design Develop $24,000 $60,000 Install& Test $16,000 duration Estimate (wks) L10 - 14 L10 - 15 4 Budgeted cost by period for Actual cost by period for the software project the software project Week Week TBC 1 2 3 4 Design 24 4 4 8 8 Develop 60 Install & Test 16 Total 100 5 6 7 8 9 10 11 12 Design Cumulative 8 8 12 12 10 1 2 3 4 5 2 5 9 5 1 2 8 Develop 10 8 8 Install & Test 6 7 Total Spent 8 22 10 14 12 46 0 4 4 8 8 8 8 12 12 10 10 8 8 Total 2 5 9 7 9 10 14 12 4 8 16 24 32 40 52 64 74 84 92 100 Cumulative 2 7 16 23 32 42 56 68 68 (amounts are in thousand dollars) (amounts are in thousand dollars) L10 - 16 Cumulative percentage complete by period L10 - 17 Cumulative Earned Value by period Week 1 2 3 4 Weeks 5 6 7 8 TBC Design 10 25 80 80 100 100 100 100 Develop 0 0 0 5 15 25 40 50 Install & Test 0 0 0 0 0 0 0 0 Design 24 Build 60 Install & Test 16 Cumulative 1 100 2.4 2.4 2 6 6 3 4 19.2 21.6 24 24 24 24 3 9 15 24 30 24.6 33 39 48 54 19.2 5 6 7 8 (amounts are in thousand dollars) L10 - 18 L10 -19 5 Cost Forecasting Cost performance index and cost variance 1. Assuming that the remainder of the project continues to be performed at the same efficiency rate CPI = BCWP/ACWP = $54,000/$68,000 = 0.79 This ratio indicates that for every $1.0 actually spent, only $0.79 of earned value was received. FCAC = Total Budgeted Cost/ CPI = $100,000/ 0.79 = $126,582 2. Ignoring the past efficiency rate, assuming that the work on the remaining portion of the project will be done according to budget CV = BCWP- ACWP = $54,000- $68,000 =- $14,000 This indicates that the value of work performed through to week 8 is $14,000 less than the amount actually spent. FCAC = ACWP + (TBC – BCWP) = $68,000 + ($100,000 - $54,000) = $114,000 L10 -20 Graph of Budgeted cost, Actual cost and Earned Value Bar chart of Budgeted Cost, Actual Cost and Earned Value 100 100 90 Cost ($’000) L10 -21 90 80 80 70 70 60 60 50 50 40 40 68% 30 30 Budgeted Actual 20 64% Series1 54% Percentage Budgeted Cost to have been spent Percentage Cost Actually spent Percentage of Work Completed 20 Earned Value 10 10 0 0 1 1 2 3 4 5 6 7 8 9 10 11 2 3 12 Weeks L10 - 22 L10 - 23 6 Risk Management Learning Objectives Risk Management Understand what risk is and the importance of good project risk management Suggested Readings Discuss the elements involved in risk management planning Schwalbe, IT Project Management, Chapter 11 List common sources of risks on projects Boehm B, Tutorial: Software Risk Management. IEEE Computer Society Press, 1989. Describe the risk identification process and tools and techniques to help identify project risks Hall E M, Managing Risk: Methods for Software Systems Development. Addition-Wesley, 1998. Discuss the qualitative risk analysis process and explain how to calculate risk factors, use probability/impact matrix, the Top Ten Risk Item Tracking technique, and expert judgment to rank risks L10 L10 - 24 What is Risk? Importance of Project Risk Management Project risk management is about identifying, assigning, and responding to risk throughout the life of a project and in the best interests of meeting project objectives Risk management is often overlooked on projects, but it can help improve project success by helping select good projects, determining project scope, and developing realistic estimates A dictionary definition of risk is “the possibility of loss or injury” Project risk involves understanding potential problems that might occur on the project and how they might impede project success Risk management is like a form of insurance; it is an investment KPMG study (2001) found that 55 percent of runaway projects did no risk management at all L10 - 25 L10 -26 7 What is Project Risk Management? What is Project Risk Management? (cont.) The goal of project risk management is to minimize potential risks while maximizing potential opportunities. Major processes: - Risk management planning: deciding how to approach and plan the risk management activities for the project - Risk identification: determining which risks are likely to affect a project and documenting their characteristics - Qualitative risk analysis: characterizing and analyzing risks and prioritizing their effects on project objectives - Quantitative risk analysis: measuring the probability and consequences of risks - Risk response planning: taking steps to enhance opportunities and reduce threats to meeting project objectives - Risk monitoring and control: monitoring known risks, identifying new risks, reducing risks, and evaluating the effectiveness of risk reduction L10 - 27 What needs controlling L10 - 28 Software Risk Quality - a task has not really been finished unless the product of that task is satisfactory Risks are those events or conditions that may occur, and whose occurrence, if it does take place, has a harmful or negative effect on a project. A risk is a probabilistic event – it may or may not occur. - activity reported as finished could need to be re-worked For this reason, we frequently have an optimistic tendency to simply not see risks or to wish that they will not occur. This kind of attitude gets the project into trouble if the risk events materialize, something likely to happen in a large project. - testing is difficult to control: depends on an unknown number of errors L10 - 29 L10 - 30 8 Software Risk Risk and Risk Management Many projects do not follow a formal risk management Approach. Because of their failure to plan for the unexpected, they find themselves in a state of perpetual crisis, inability to make effectively and timely decisions. Many call this approach crisis management or fire fighting because the project stakeholders take a reactive approach or only address the project risks after they have become problems. Unforeseen events have an adverse impact on a project’s cost, schedule, or quality. The aim of risk management is not to avoid getting into projects that have risk but rather to minimize the impact of risks in the project that are undertaken. “Anything worth doing has risks” L10 - 32 L10 – 31 Nature of Risks Risk Management Processes Risks result from three general classes: • Risk Management Planning Known risks • Risk Identification (events that are going to occur, eg death and taxes) • Qualitative Risk Analysis Known-unknown risks • Quantitative Risk Analysis (identifiable uncertainties, eg errors in the code but number not known) • Risk Response Planning Unknown-unknown risks • Risk Monitoring and Control (risks or events we can not even imagine happening, eg a few years ago people had not even heard of internet how could they comprehend the impact it would have on us) L10 - 33 L10 - 34 9 Types of Risks Risk Sources Technical Technical Operational Political Legal Supportability Programmatic Regulatory Market Social Internal Cost External Schedule L10 - 35 Risk Management Analysing and Quantifying Risks Some new and some old tools are: L10 - 36 Risk Management is the formal process of Brainstorming Delphi method Sensitivity analysis Probability analysis Monte Carlo simulation Decision tree analysis Risk identification Risk quantification Risk response development, and Risk response control L10 - 37 L10 - 38 10 Risk Management Risk Assessment aims to identify the risks and then take actions to minimize their effect on the project. To identify, analyze and prioritize the risks Two key components of Risk management Risk Assessment Risk Control To prioritize risks, estimate the probability of its occurrence and its consequence when it does occur. The product of these values, the expected value of the loss for the risk (called risk exposure), can be used for prioritizing Risk identification Risk Assessment Risk analysis Risk prioritization Risk Management RE (R) = Prob (R) × Loss (R) Risk management planning Risk Control Risk resolution Risk monitoring L10 – 40 L10 - 39 Summary - Risk Management Risk Control After the risks are prioritized, decide which ones will be managed is a management decision. Software Engineering Institute Identify - search for and locate risks before they become problems One approach is to take preventive or avoidance actions so that the perceived risk ceases to be a risk. For each risk, you must devise and execute risk management plans. Because the perception of risk changes with time, you must also monitor both the risk and the execution of the plans to minimize its consequences. Analyze - transform risk data into decision-making information, evaluate impact, classify risks and prioritize risks. Plan - translate risk information into decisions and mitigating actions and implement those actions. Track - monitor risk indicators and mitigation actions. Control - Correct for deviations from the risk mitigation plans. Risk management can be integrated in the software development process itself. L10 - 41 L10 - 42 11 Risk Concepts – An Example Example Consider a computer show for which an important goal is to provide uninterrupted computer services. (cont.) It is not easy to measure the value of risk or risk management. For this goal, one clear risk is electric power failure. The power may or may not fail. If it does fail, even for a second, the computer services will be affected substantially (the machines will have to reboot, data will be lost , and so on). If this case is unacceptable (that is, if the cost of power failure is high), a universal power supply (UPS) can be deployed to minimize its consequences. Suppose, however, that the power supply does not fail even for a second. If it is suspected that the power may go out for a long period, a backup generator may be set up to minimize the problem. Does this mean that the expenditure on these components was a waste? With this risk management systems in place, if the power does go out, even for a long period, the show related goals will not be compromised. If the power fails for one-half hours during the show, the value provided by the UPS and generator might be calculated as the “savings” achieved by having the computer running while the power was out. No, because the power could have failed. The value of risk management cannot be directly measured in term of value or output produced. L10 -44 L10 - 43 Example (cont.) Note Risk entails Additional Cost (cost of the generator etc) These components (the UPS and generator) won’t be needed if the risk of power failure did not exit. Next week Quality Management Risk management is considered cost- effective only if the cost of risk management is considerably less than the loss incurred if the risk materialize. L10 -45 12
